Figure 4.
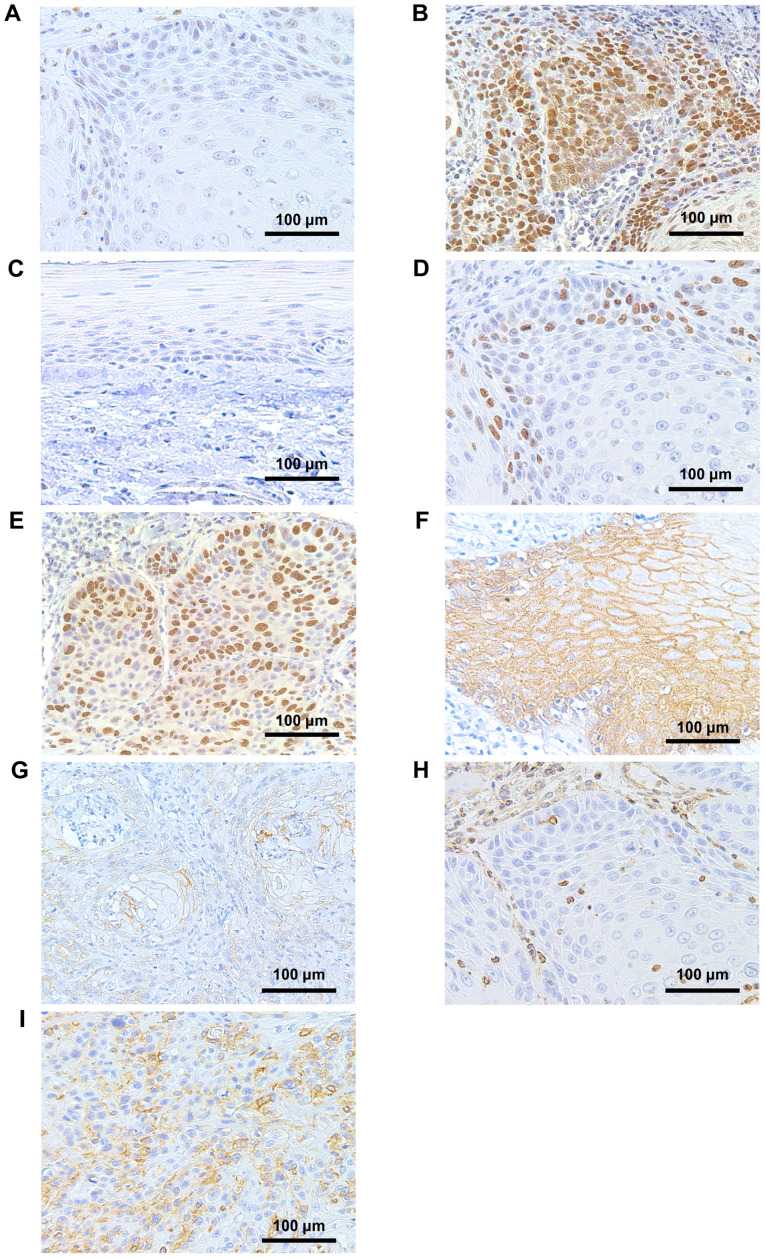
Immunohistochemical staining showing low and high expressions of (A and B) p53, (D and E) Ki-67, and (C) normal expression of p53. Images demonstrating (F) preserved and (G) reduced E-cadherin expression. Images demonstrating (H) negative and (I) positive expression of Vimentin (magnification, ×200).

