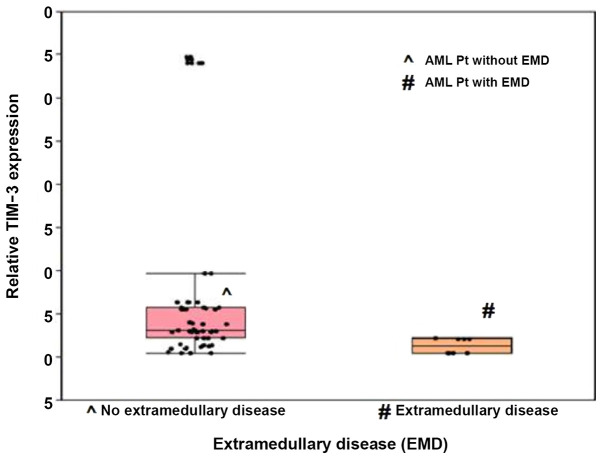
Figure 3.
Box plot illustrating TIM-3 fold expression level in cases of acute myeloid leukemia with and without extramedullary disease. Boxes represent the interquartile range. The lines inside the box represent the median. Whiskers represent minimum and maximum values. Dots represent individual observations. TIM-3, T-cell immunoglobulin and mucin domain 3.

