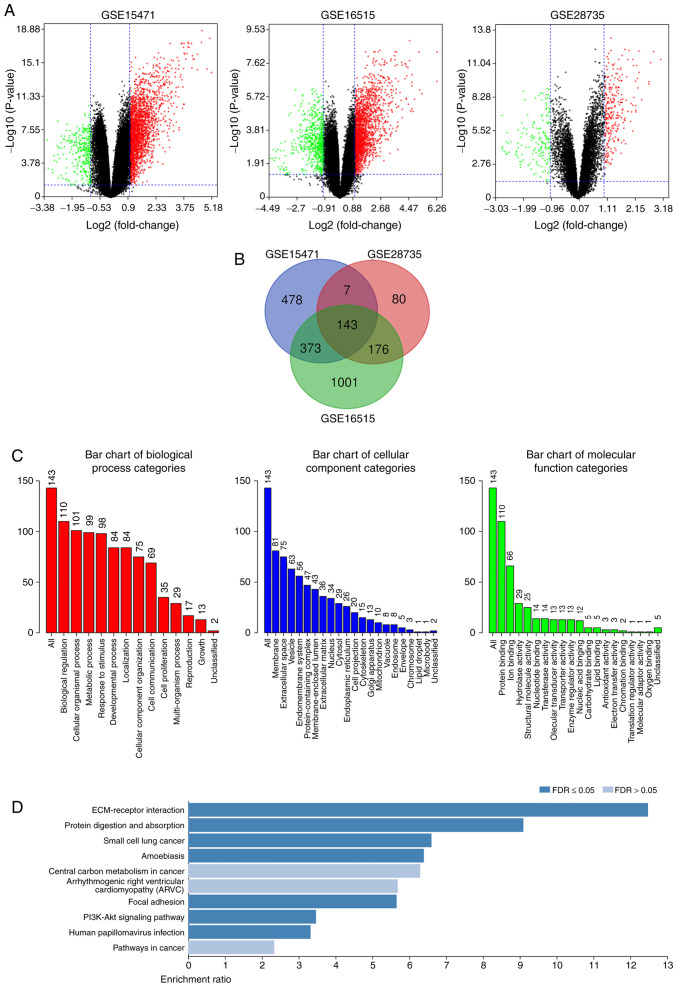
Figure 1.
Identification of DEGs in PDAC, and functional and signaling pathway enrichment analyses. (A) Volcano plot of genome-wide gene expression profiles in pancreatic ductal adenocarcinoma tissues and adjacent normal tissues from the GSE15471, GSE16515 and GSE28735 datasets. Red plots represent upregulated genes with P<0.05 and log2 FC >1, black plots represent normally expressed genes and green plots represent downregulated genes with P<0.05 and log2 FC <-1. (B) The intersection of the three microarray datasets contained 143 DEGs. (C) Gene Ontology and (D) Kyoto Encyclopedia of Genes and Genomes functional and signaling pathway enrichment analyses of the DEGs were performed using the DAVID database. P<0.05 was set as the threshold. DEGs, differentially expressed genes.

