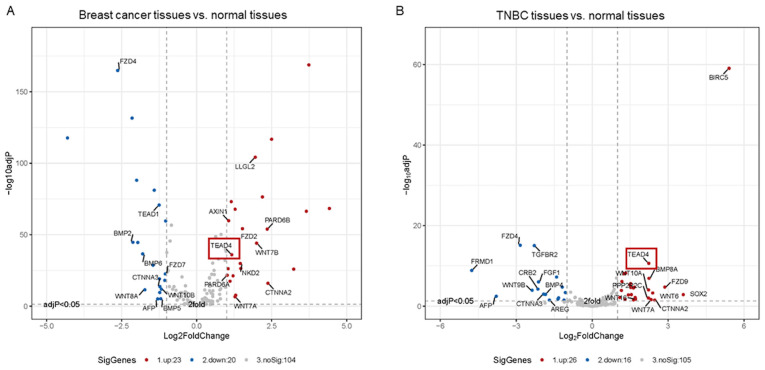
Figure 2.
Volcano maps of the Hippo signaling pathway-related differentially expressed genes in (A) Breast cancer tissues vs. normal tissues (B) TNBC tissues vs. normal tissues. Red dots represent upregulatedgenes, while blue dots represent downregulated genes in breast cancer or TNBC. Gray dots indicate fold-change <2 or no statistically significant difference. TNBC, triple-negative breast cancer; TEAD, transcriptional enhancer factor domain.

