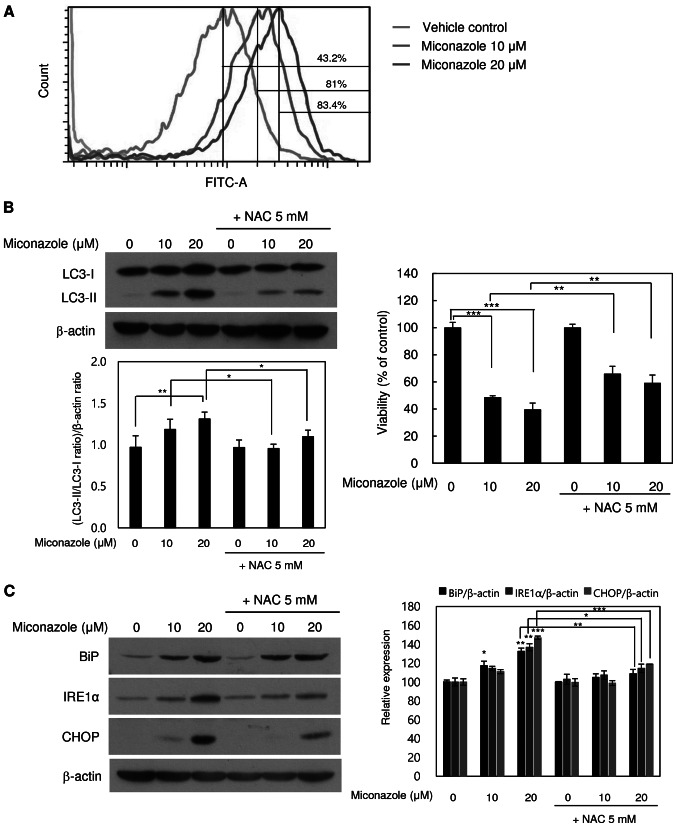
Figure 4.
ROS- and ER stress-inducing effects of miconazole in relation to autophagic cell death. (A) ROS production in cells treated with miconazole for 10 min, as measured by flow cytometry. Fluorescence intensity is directly proportional to the quantity of ROS species in the cells. (B) Levels of LC3-I and LC3-II proteins in U251MG cells treated with miconazole in the presence or absence of 5 mM NAC, as determined by western blotting and densitometry using β-actin as a loading control. (C) Levels of BiP, IRE1α and CHOP proteins in cells pretreated with 5 mM NAC for 2 h and then treated with miconazole at the indicated concentrations for 24 h, as determined by western blotting using β-actin as a loading control. Densitometric analysis of the western blots is shown in the bar graph. Densitometric and cell viability data are the mean ± standard deviation of three independent experiments. *P<0.05, **P<0.01 and ***P<0.001. ROS, reactive oxygen species; ER, endoplasmic reticulum; LC3, microtubule-associated protein light chain 3; NAC, N-acetylcysteine; BiP, binding immunoglobulin protein; IRE1α, inositol-requiring enzyme 1α

