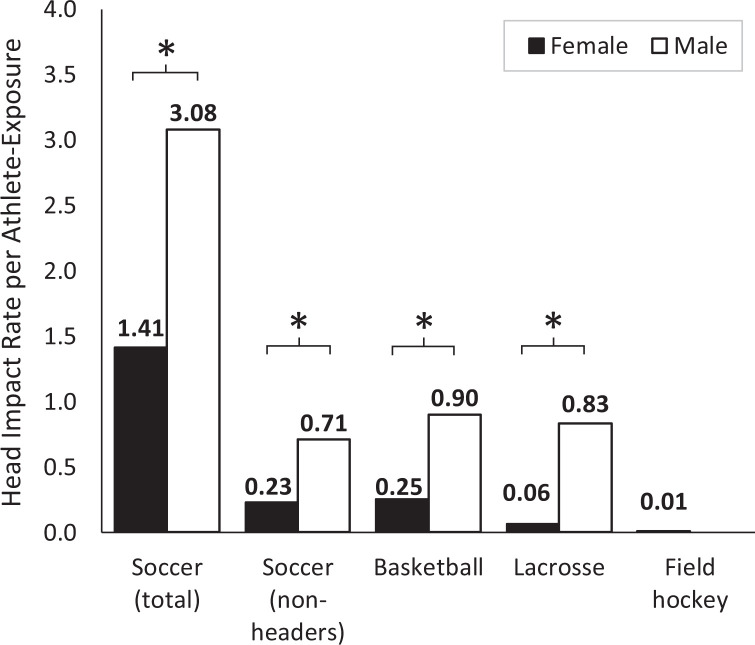
Figure 2.
Head impact rates per athlete-exposure. For soccer, the impact rate is presented as all impacts and all non–head to ball impacts (ie, equipment to head, fall, and player to head). For all other sports, the bars represent all impacts. *Boys had a higher impact rate as compared with girls in soccer (rate ratio [95% CI], 2.2 [1.8-2.6]), nonheaders in soccer (3.1 [2.6-3.7]), basketball (3.6 [2.6-4.6]), and lacrosse (12.9 [10.1-15.8]).

