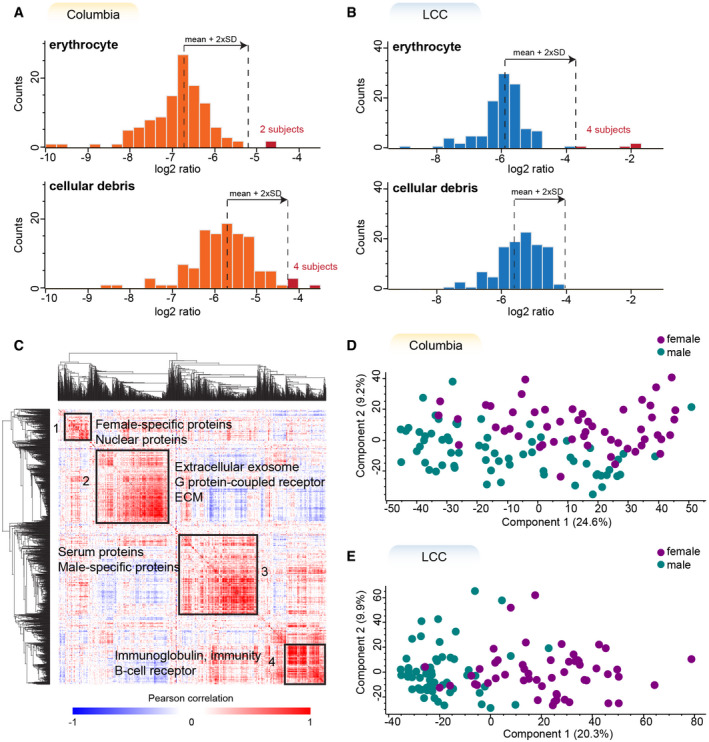
Figure 2. The large majority of urine samples has high quality and shows sex‐specific protein expression.

-
A, BHistograms of log2 transformed ratios of the summed intensity of the proteins in the respective quality marker panel and the summed intensity of all proteins in Columbia (A) and LCC (B) cohorts. A sample was flagged for potential contamination and removed from further analysis if the ratio differed more than two standard deviations from the mean of all samples within the cohort. The proteins in each quality marker panel are listed in Dataset EV3.
-
CGlobal correlation map of proteins generated by clustering the Pearson correlation coefficients of all pairwise protein comparisons for the Columbia cohort.
-
D, EPrincipal component analysis (PCA) of all subjects based on their urinary proteome profiles. Female subjects are shown in purple and males in green.
