
Figure 3. PD affects the urinary proteome.
-
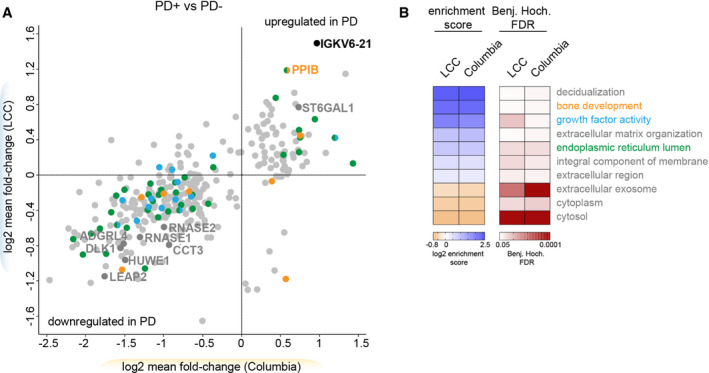
ACorrelations of mean fold‐changes of the proteins changing PD‐dependently in the Columbia and LCC cohorts. Only proteins quantified in both cohorts are shown (n = 330). The colors match to the GO terms shown in (B). Proteins overlapping between the two cohorts are labeled with their name.
-
BFisher exact test to identify significantly enriched GO terms in the PD‐associated proteins in urine. Importantly, the enrichment score of the Fisher exact test does not indicate if the proteins were up‐ or downregulated in PD patients but rather that the regulated proteins—independent of the directionality—compared to the total urinary proteome are associated with the enriched term. All GO terms that were significant in both cohorts are displayed (FDR < 5%).