
Figure 6. Machine learning‐based classification of PD and LRRK2 status.
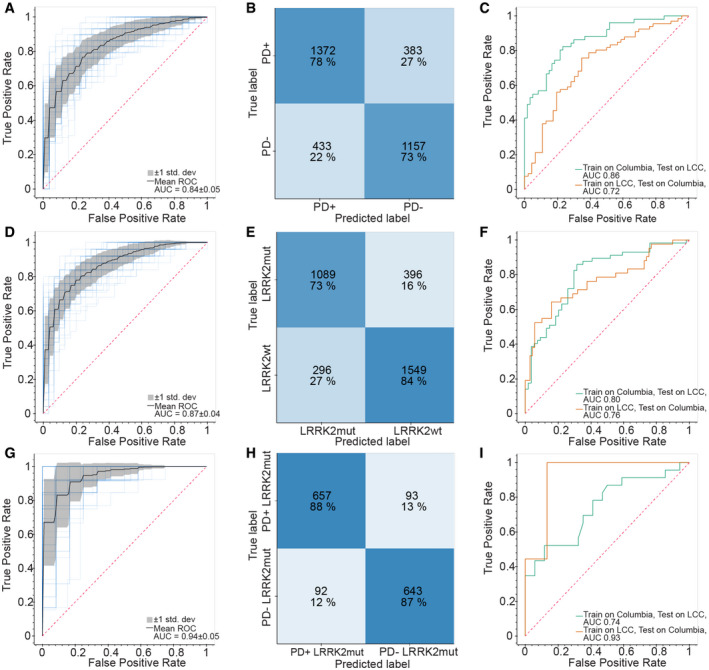
- Receiver operating characteristic (ROC) curve for the XGBoost‐based model to classify PD+ vs. PD− individuals. Random performance is indicated by the dotted diagonal line. The gray area represents the standard deviation from the mean ROC curve. The blue lines show the values for a total of 15 repeats with four stratified train‐test splits.
- Confusion matrix showing the model performance for classifying PD+ vs. PD− individuals. Numbers represent the mean number from 15 repeats of cross‐validation with four stratified train‐test splits.
- ROC curve for the XGBoost‐based model when trained on one cohort and tested on the other cohort. Random performance is indicated by the dotted diagonal line.
- Same as (A) but for classification of LRRK2 G2019S vs. LRRK2 WT carriers.
- Same as (B) but for classification of LRRK2 G2019S vs. LRRK2 WT carriers.
- Same as (C) but for classification of LRRK2 G2019S vs. LRRK2 WT carriers.
- Same as (A) but for classification of PD+ vs. PD− in LRRK2 G2019S carriers.
- Same as (B) but for classification of PD+ vs. PD− in LRRK2 G2019S carriers.
- Same as (C) but for classification of PD+ vs. PD− in LRRK2 G2019S carriers.