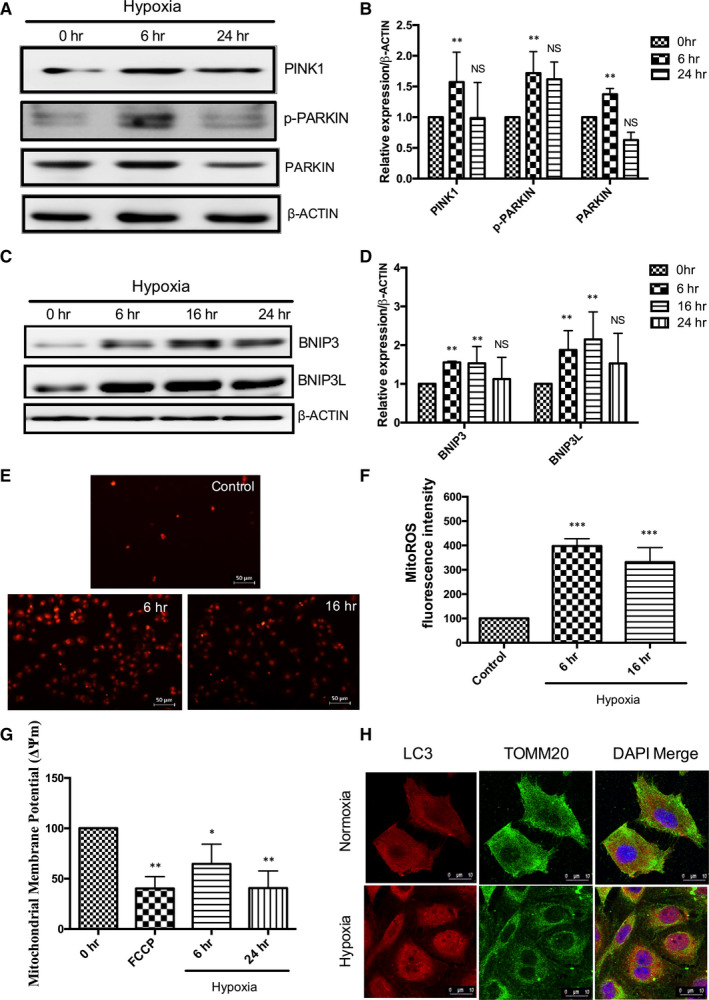
FIGURE 1.

Hypoxia induces mitochondrial dysfunction and mitophagy in HK‐2 cells. (A, B) Hypoxia induces PINK1, p‐PARKIN and PARKIN expression under hypoxia. Results of densitometric analysis shown as mean ± SD, n = 3; non‐significant (NS),**P < .01 compared with 0 hour, two‐way ANOVA followed by Tukey's multiple comparisons test. (C, D) Increased BNIP3 and BNIP3L expressions under hypoxia. Results of densitometric analysis shown as mean ± SD, n = 3; non‐significant (NS),**P < .01 compared with 0 hour, two‐way ANOVA followed by Dunnett's multiple comparisons test. (E, F) Hypoxia induces MitoROS fluorescence intensity, Scale‐50 µm, Magnification‐200×; (G) Hypoxia induces change in mitochondrial membrane potential. The results are shown as mean ± SD, n = 3, *P < .05,**P < .01,***P < .001 compared with control, one‐way ANOVA followed by Dunnett's multiple comparisons test. (H) Hypoxia induces LC3 localization with mitochondria (TOMM20). LC3‐Red; TOMM20 (green); DAPI (Blue). Scale‐10 µm, Magnification‐1,260×
