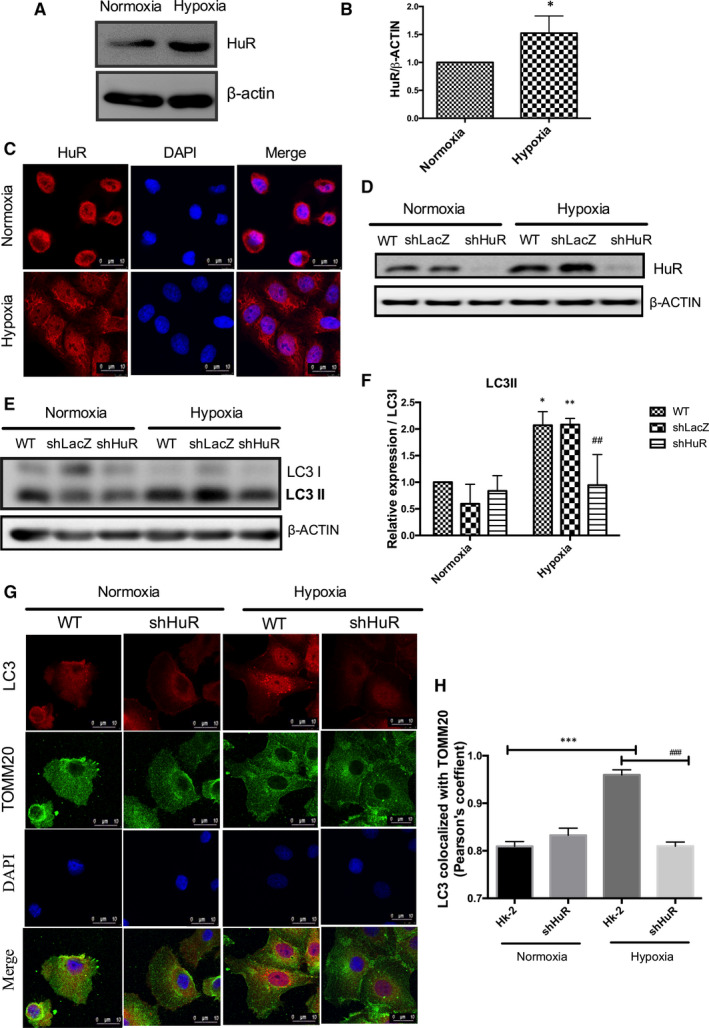
FIGURE 2.

HuR regulates hypoxia‐induced mitophagosome formation in renal tubular cells. (A, B) Hypoxia up‐regulates HuR expression compared to normoxia. The data are expressed as mean ± SD, n = 3, two‐tailed unpaired t‐test, *P < .05 compared to normoxia. (C) Confocal analysis of cytoplasmic localization of HuR under hypoxia. Red‐HuR, Blue‐DAPI. Scale‐10 µm, Magnification‐1260× (D) HK‐2 shHuR cells shows down‐regulated HuR expression under normoxia and hypoxia. (E, F) Knockdown HuR significantly down‐regulates hypoxia‐induced LC3II expression. The relative density of LC3II/LC3I expression is represented as mean ± SD, n = 3, *P < .05, **P < .01, compared with WT‐normoxia; ## P < .01 compared with WT‐hypoxia. Two‐way ANOVA followed by Sidak's multiple comparisons test. (G) Effect of HuR on mitophagosome formation under hypoxia as analysed by immunofluorescence analysis. LC3‐Red; TOMM20 (green); DAPI (Blue). Scale‐10 µm, Magnification‐1,260× (H) The bar graph shows Pearson's coefficient for the co‐localization of LC3 with TOMM20. The values are mean ± SD, n = 3, ***P < .001 compared with HK‐2 normoxia, ### P < .001 compared with HK‐2‐Hypoxia, two‐way ANOVA followed by Dunnett's multiple comparisons test
