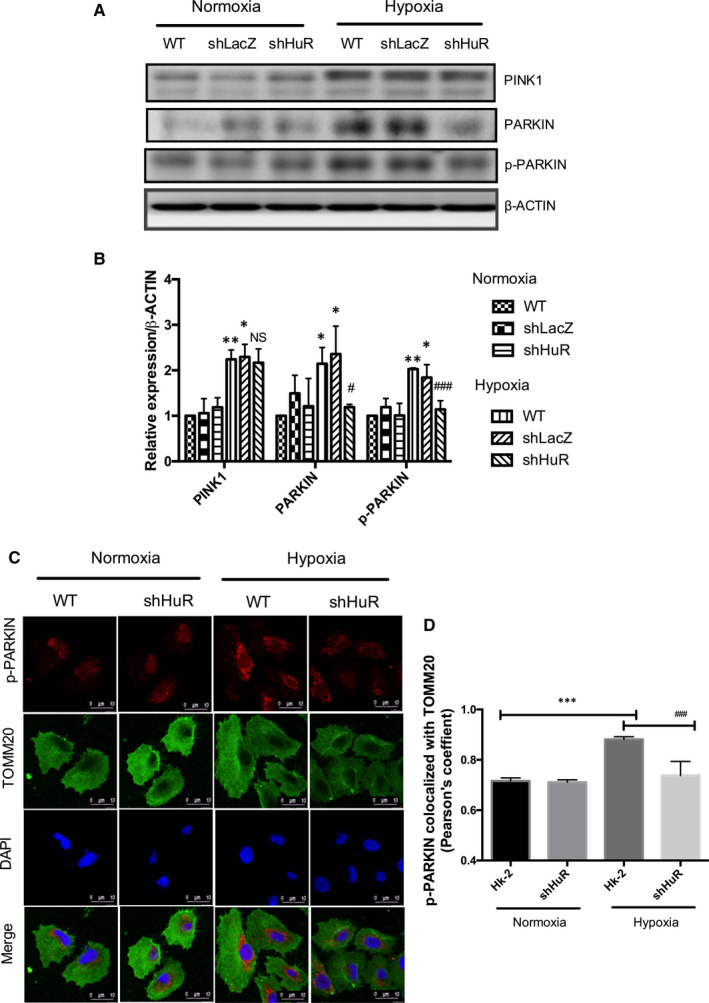
FIGURE 4.

HuR regulates hypoxia‐induced p‐PARKIN/PARKIN expression. (A, B) Effect of HuR on hypoxia‐mediated mitophagy protein (PINK1, p‐PARKIN and PARKIN) expressions. The relative density of western blot results shows that shHuR cells significantly down‐regulated p‐PARKIN and PARKIN expressions compared to WT cells under hypoxia. The results are shown as mean ± SD, n = 3, *P < .05, **P < .01 compared to WT‐normoxia; non‐significant (NS), # P < .05, ### P < .001, compared to WT‐hypoxia; two‐way ANOVA followed by Sidak's multiple comparisons test. (C) Immunofluorescence showing p‐PARKIN translocation to mitochondria (TOMM20) regulated by HuR under hypoxia. p‐PARKIN‐Red; TOMM20 (green); DAPI (Blue). Scale‐10 µm, Magnification‐1260X (D) Pearson's coefficient for the co‐localization of p‐PARKIN with TOMM20. The values are mean ± SD, n = 3, ***P < .001 compared with HK‐2 normoxia, ### P < .001 compared with HK‐2‐Hypoxia, two‐way ANOVA followed by Dunnett's multiple comparisons test
