-
A, B
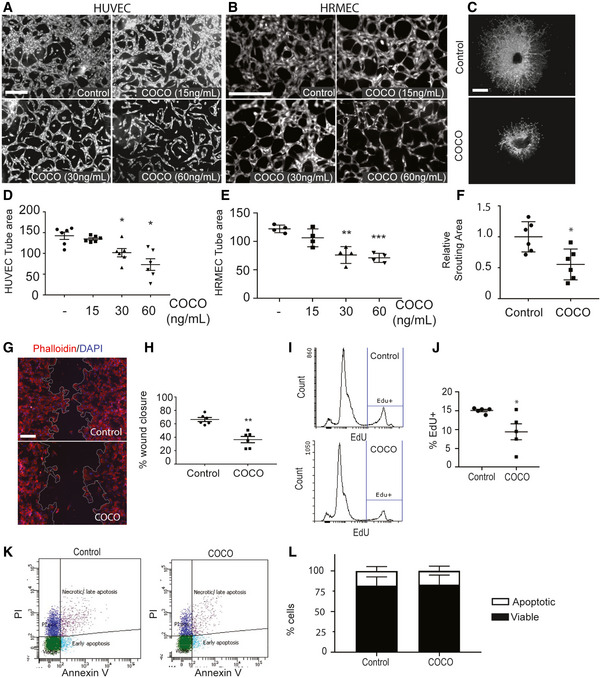
Representative images of HUVECs (A; n = 6) and HRMECs (B; n = 4) sprouting in a fibrin gel with VEGF (25 ng/ml) in the presence or absence of COCO. Scale bar, 75 μm.
-
C
Representative images of choroidal explants cultured for 5 days in the presence or absence of COCO. Scale bar, 500 μm.
-
D, E
Quantification of tube surface area of micrographs shown in (A, B). Results are presented as mean ± SEM; statistical analyses were performed using Mann–Whitney test. (D: *P = 0.0119 (– vs. COCO 30 ng/ml); *P = 0.0108 (– vs. COCO 60 ng/ml); (E: **P = 0.0013 (– vs. COCO 30 ng/ml); ***P = 0.00026 (– vs. COCO 60 ng/ml)).
-
F
Quantification of sprouting surface area of micrographs shown in (C; n = 6). Results are presented as mean ± SEM, statistical analyses were performed using Mann–Whitney test. *P = 0.0107.
-
G
COCO decreases scratch wound migration after 18 h. Scale bar, 150 μm.
-
H
Quantification of wound closure. Results are presented as mean ± SEM, statistical analyses were performed using Mann–Whitney test. **P = 0.0010; (n = 6).
-
I
COCO decreases EdU incorporation in cultured HUVECs.
-
J
Quantification of EdU incorporation. Results are presented as mean ± SEM, statistical analyses were performed using Mann–Whitney test. *P = 0.0317; (n = 5).
-
K
COCO does not induced apoptosis in HUVECs.
-
L
Quantification of apoptotic (Annexin V‐positive) and viable (Annexin V‐negative) cells (n = 4).

