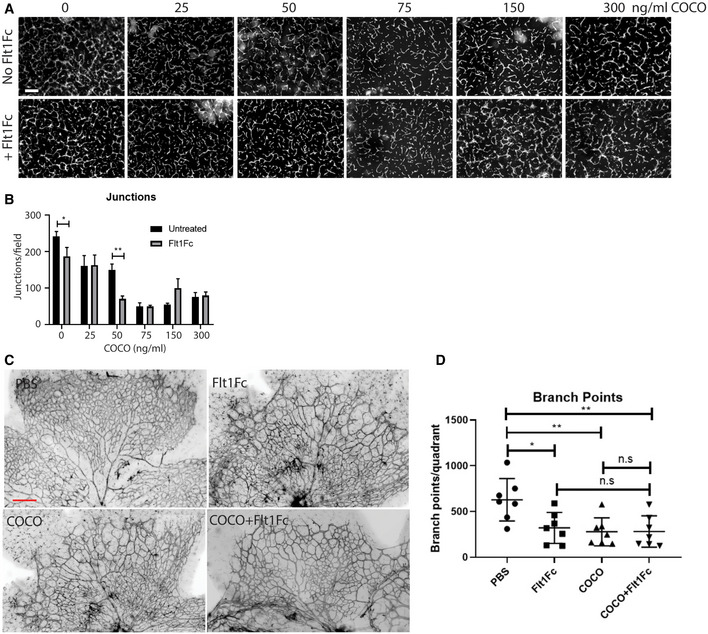
Figure EV3. Effect of the combination of COCO and VEGF inhibition on angiogenesis.

- Representative images of HUVECs sprouting in a fibrin gel with or without Flt1Fc (100 ng/ml) in the presence or absence of COCO. Scale bar, 75 μm.
- Quantification of the number of junctions/field of images shown in (A). *P = 0.0378 (Untreated vs. Flt1Fc); **P = 0.0069 (COCO50 ng/ml vs. COCO50 ng/ml + Flt1Fc); (n = 3; 5 pictures/experiment).
- Retinal flat mounts of P5 mice injected with PBS, COCO, or Flt1Fc alone or in combination are stained with IB4 (negative images of the fluorescent signal). Scale bar, 100 μm.
- Quantification of number of branchpoints. Results are presented as mean ± SEM and statistical significance was analyzed by two‐way ANOVA. *P = 0.0151 (PBS vs. Flt1Fc); **P = 0.0060 (PBS vs. COCO); **P = 0.0079 (PBS vs. COCO + Flt1Fc); n.s. = non significant; (n = 7).
