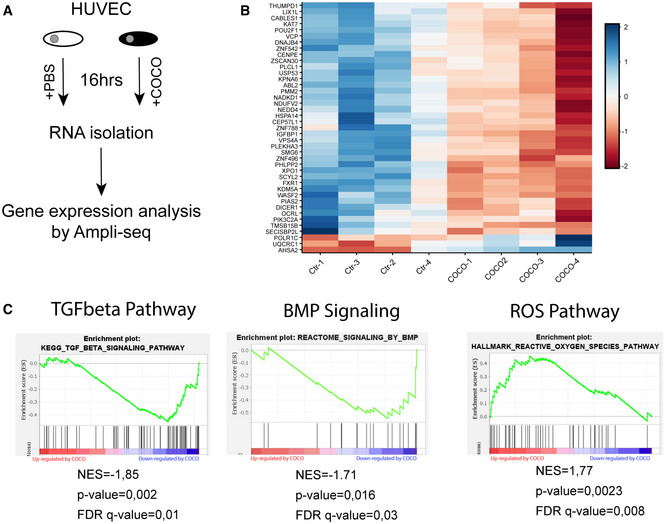
Figure 8. Transcriptional changes associated with COCO stimulation in ECs.

- Scheme of the protocol to determine differential gene expression after treatment of HUVECs 16 h with COCO.
- Differential gene expression heatmap generated by DESeq2 of top‐altered genes of HUVECs treated with COCO compared with PBS‐treated control cells (n = 4 independent samples/group).
- GSEA pathway analysis of control vs. COCO‐treated HUVECs for TGFβ, BMP, or ROS pathways.
