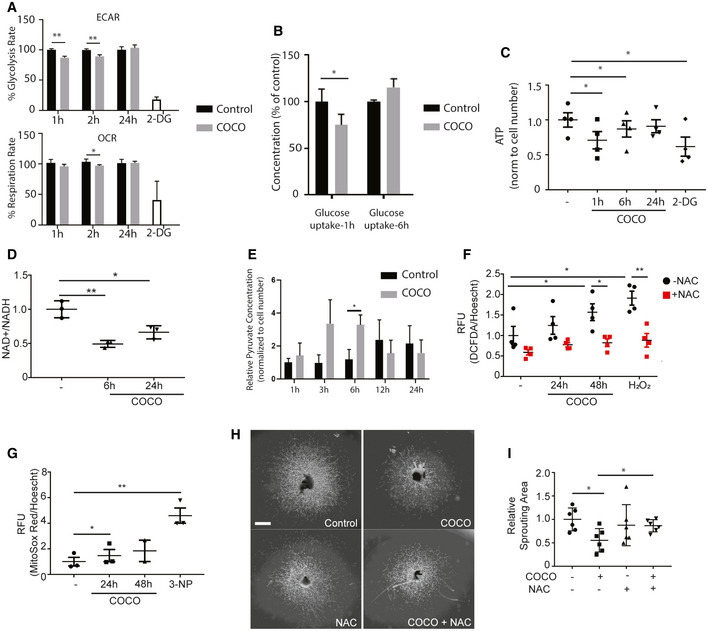
Seahorse analysis of mitochondrial respiration (OCR) and glycolysis (ECAR) in HUVECs stimulated with COCO for 1, 2, and 24 h. **P = 0.0032 for ECAR, 1 h; **P = 0.0079 for ECAR, 2 h; *P = 0.0255 for OCR, 2 h; (n = 5).
Media glucose levels (BioNova analysis) in HUVECs cultured with COCO for 1 or 6 h, expressed as % of initial levels *P = 0.0459; (n = 4).
Evaluation of ATP content in HUVECs stimulated with COCO for 1, 6, or 24 h. *P = 0.0120 (– vs. 1 h); *P = 0.0109 (– vs. 6 h); *P = 0.0219 (– vs. 2‐DG); (n = 4).
Determination of NAD+/NADH ratio in HUVECs for 6 or 24 h with COCO. **P = 0.0028 (6 h); *P = 0.0207 (24 h); (n = 3).
Evaluation of pyruvate content in HUVECs stimulated with COCO for 1, 3, 6, 12, or 24 h. *P = 0.0244; (n = 4).
Determination of cellular ROS using DCFDA fluorescence in HUVECs treated with COCO and/or N‐acetylcystein. *P = 0.0343 (– vs. 48 h‐NAC); *P = 0.0114 (– vs. H2O2‐NAC); *P = 0.0252 (48 h‐NAC vs. 48 h + NAC); **P = 0.0067 (H2O2‐NAC vs. H2O2 + NAC); (n = 4).
Determination of mitochondrial superoxide using MitoSox fluorescence in HUVECs treated with COCO. *P = 0.0372 (– vs. 24 h); *P = 0.0137 (– vs. 3‐NP); (n = 3).
Representative images of choroidal explants cultured for 4 days in the presence or absence of COCO and/or N‐acetylcystein. Scale bar, 500 μm.
Quantification of sprouting surface area of micrographs shown in (H). *P = 0.0126 (– vs. COCO‐NAC); *P = 0.0200 (COCO‐NAC vs. COCO + NAC); (n = 6). Results are presented as mean ± SEM and statistical significance was analyzed by Mann–Whitney test. *P < 0.05, **P < 0.01.

