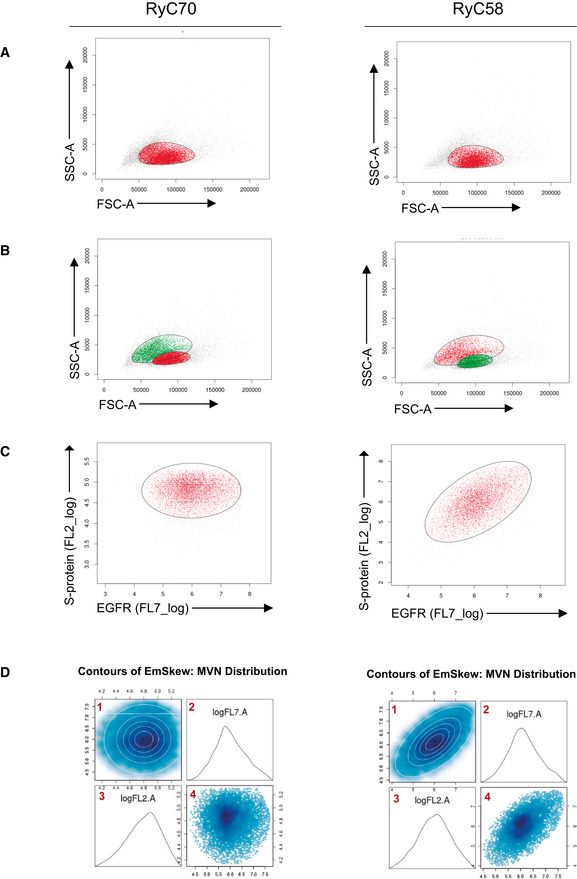
Figure EV1. Filtering and multivariate normal function adjustment of cytometry data. RyC70 is a seronegative sample; RyC58 a seropositive one.

-
A, BFirst gating on the SSC.A and FSC.A channels using a t‐mixture model with Box‐Cox transformation for clustering. A 2D plot of the signal from the cells in the SSC.A and FSC.A channels (gray, red, and green dots) is shown. In (A) a single cluster is adjusted (cells included in the cluster in red, not selected in gray), while in (B) two clusters are adjusted (cells in red for the first cluster and green for the second).
-
COver the cells selected in the first gating, a second clustering is done with the same method using channels FL7.A and FL2.A. Selected cells are marked in red, and unselected cells are represented in gray.
-
DAdjustment of the multivariate normal distribution over the signal from the FL7.A and FL2.A channels from the selected cells after the first and second gating. 1, contour of the density function fitted to the data. 2, density plot of the signal in channel FL7.A. 3, density plot of the signal in channel FL2.A. 4, 2D plot of signal from cells in channels FL7.A and FL2.A.
