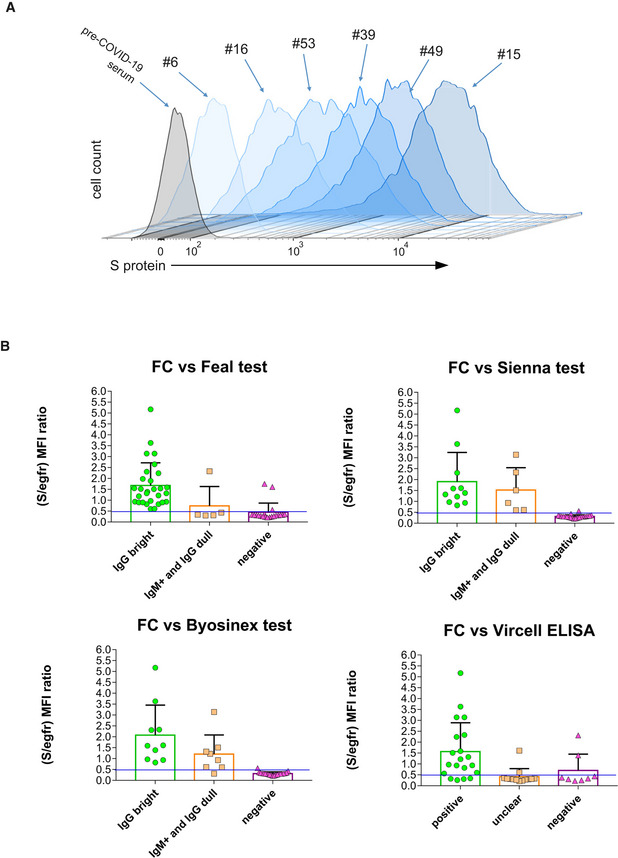
Bar plots of flow cytometry data generated with Jurkat‐S cells and the panel of serum samples of Table
EV1 classified according to their result in the indicated commercial tests: green, positive for the test; orange, weak, or unclear; magenta, negative samples. Flow cytometry data are expressed as the ratio between the MFI of the antibody anti‐S and the MFI for EGFR. Negative values for the flow cytometry test are those with a S/EGFR MFI ratio lower than 0.5. This ratio was set in order to fit most of the data negative for the other serological tests (pink triangles) under that threshold. Data represent the mean ± s.e.m. All datapoints are shown.