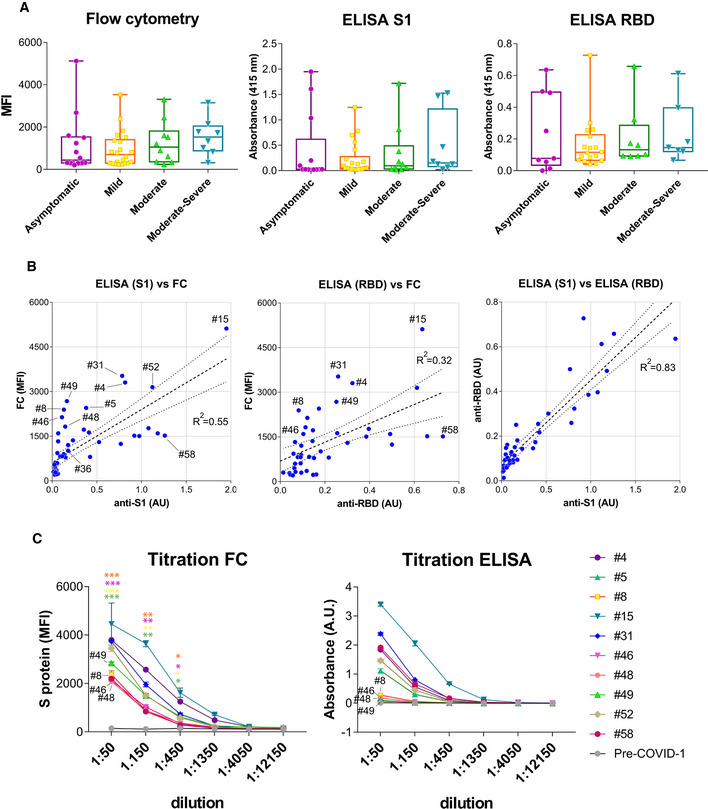
Box and whiskers plot of MFI and absorbance data in human sera according to their clinical classification of COVID‐19 symptoms. Clinical classification was done according to the following parameters: Asymptomatic, no symptoms; mild, three or more of the following symptoms: non‐productive cough, hyperthermia, headache, odynophagia, dyspnea, asthenia, myalgia, ageusia, anosmia, cutaneous involvement; moderate, three or more of the above symptoms plus gastrointestinal symptoms, or more than three of the above for seven or more days; and moderate–severe, three or more of the above symptoms plus pneumonia. Box and whiskers are shown to represent the minimum and maximum values as well as the median. All datapoints are shown.
Comparison of MFI vs absorbance data generated by flow cytometry and ELISA for all human sera. A lineal regression curve was adjusted, with a 95% confidence interval, to all data with the R
2 values indicated in the plots. Selected samples of outliers (#4, #5, #8, #31, #46, #48, #49, and #58) as well as samples close to a diagonal (#36, #52, and #15) are indicated.
Titration of selected human sera by ELISA using the S1 protein and by flow cytometry with Jurkat‐S cells. Samples with antibodies detected by flow cytometry and not by ELISA are indicated (#8, #46, #48, #49). Data represent the mean ± SD of duplicates. An unpaired two‐tailed t‐test was carried out to compare the results of 1:50, 1:150, and 1:450 dilutions of sera #8, #46, #48 and #49 by FC to the pre‐COVID‐1 sample as a negative control. *P < 0.05; **P < 0.005; ***P < 0.0005.