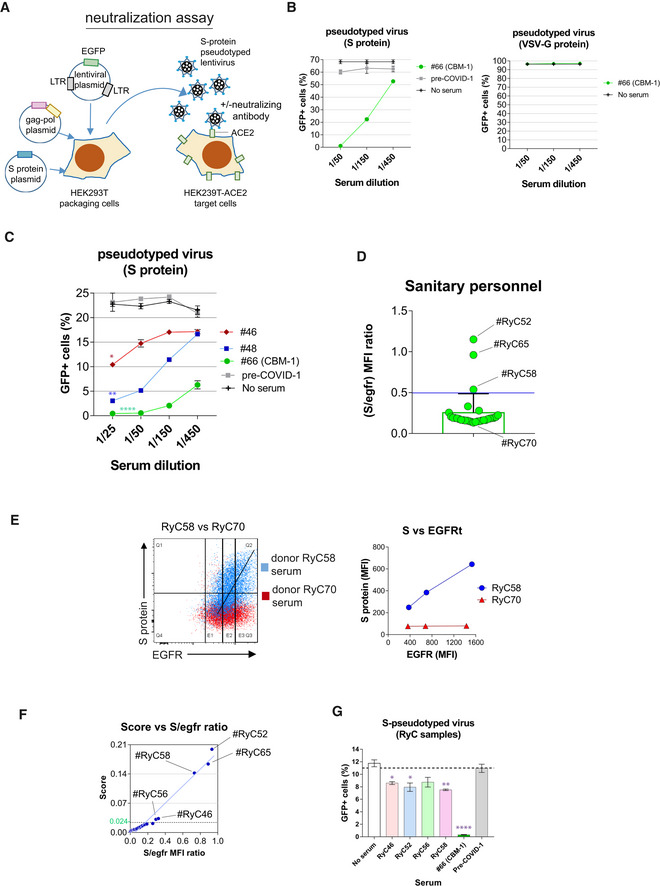
Figure 4. Sera not detected by ELISA but detected by flow cytometry with Jurkat‐S contain neutralizing antibodies.

- Cartoon of the strategy for generation of pseudotyped lentiviruses. HEK‐293T cells were transfected with a lentiviral construct containing the EGFP marker gene and two more plasmids encoding for the gag and pol genes of HIV‐1 and for the S protein of SARS‐CoV‐2. Alternatively, the latter plasmid was replaced by another one encoding the G protein of VSV. The cell supernatants collected after 48 h of transfection were used to transduce HEK‐293T cells stably transfected with human ACE2.
- Validation of the neutralization method was carried out with cell HEK‐293T cell culture supernatants containing lentiviral particles pseudotyped with either the S protein or with the VSV G protein. The supernatants were mixed with sera from donor #66 at the indicated dilutions or from a pre‐COVID sample as a control before addition onto HEK‐293T‐ACE2+ cell cultures. No serum refers to a control containing no human sera. Data represent the mean ± SD of triplicates.
- The presence of neutralizing antibodies in sera from donors #46 and #48 found negative by ELISA and positive by flow cytometry (Fig 3C) was demonstrated as in panel B. Data represent the mean ± SD of triplicates. *P < 0.05; **P < 0.005; ****P < 0.00005 (paired two‐tailed t‐test comparing all serum dilutions to the pre‐COVID sample).
- Bar plot showing the S/EGFR MFI ratio determined by flow cytometry analysis with Jurkat‐S of serum samples from 30 sanitary personnel repeatedly tested as PCR negative for SARS‐CoV‐2 at the Ramón y Cajal Hospital of Madrid. A negative result is considered for a ratio lower than 0.5. Two clear cases of sera positive for anti‐S IgG1 are indicated (RyC52 and RyC65). A borderline sample just above the threshold line (RyC58) is also indicated. Data show the mean ± s.e.m. All datapoints are shown.
- Two‐color dot plot overlay of anti‐S protein fluorescence vs EGFR fluorescence for borderline serum sample RyC58 (blue) and the clearly negative RyC70 sample (red). The line plot to the right shows the MFI for EGFR taken at the three sectors indicated in the two‐color plot and the corresponding MFI values for EGFR.
- Plot of the S/EGFR MFI ratio for the 30 RyC samples vs a Score generated according to the slope of S/EGFR and shape (see Materials and Methods and Fig EV1). The green line indicates the threshold point (0.024) for the Score above which a serum is considered positive.
- The presence of neutralizing antibodies in sera from donors RyC46, RyC52, RyC56, and RyC58 diluted 1/15 was demonstrated as in panel B. Data represent the mean ± SD of triplicates. *P < 0.05; **P < 0.005; ****P < 0.00005 (unpaired two‐tailed t‐test comparing each serum to the no serum sample).
