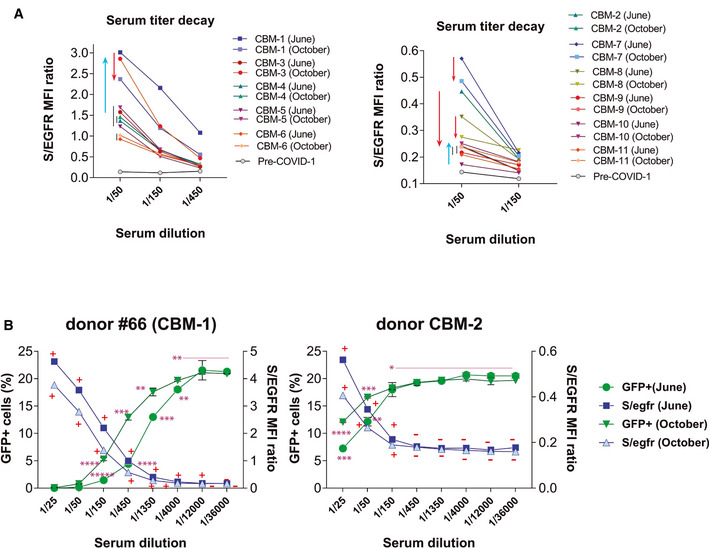
Figure 6. Evolution of the presence of anti‐S antibodies between the months of June and October 2020.

- A collection of serum samples from volunteers working at the CBMSO were taken in the months of June and October 2020 and tested by flow cytometry using Jurkat‐S cells at the indicated dilutions. Flow cytometry data are shown as the S/EGFR MFI ratio. Red arrows indicate a loss in titer of antibodies between June and October, whereas blue arrows indicate an increase in antibody titer.
- Titration of the neutralizing capacity of sera from a high titer (#66‐CBM‐1) and a low titer (CBM‐2) donor taken in June and October 2020. The neutralization experiment was carried out in parallel to a FC Jurkat‐S test. Flow cytometry results are shown as the S/EGFR MFI ratio (right y‐axis) and according to the Score value. A plus symbol (+) indicates a Score > 0.024 for a given serum dilution; a minus symbol (−) indicates a Score < 0.024. Neutralization data are shown as the percentage of HEK‐293T‐ACE2+ cells becoming GFP+ (left y‐axis). Data represent the mean ± SD of duplicates. *P < 0.05; **P < 0.005; ***P < 0.0005; ****P < 0.00005; *****P < 0.000005 (unpaired two‐tailed t‐test).
