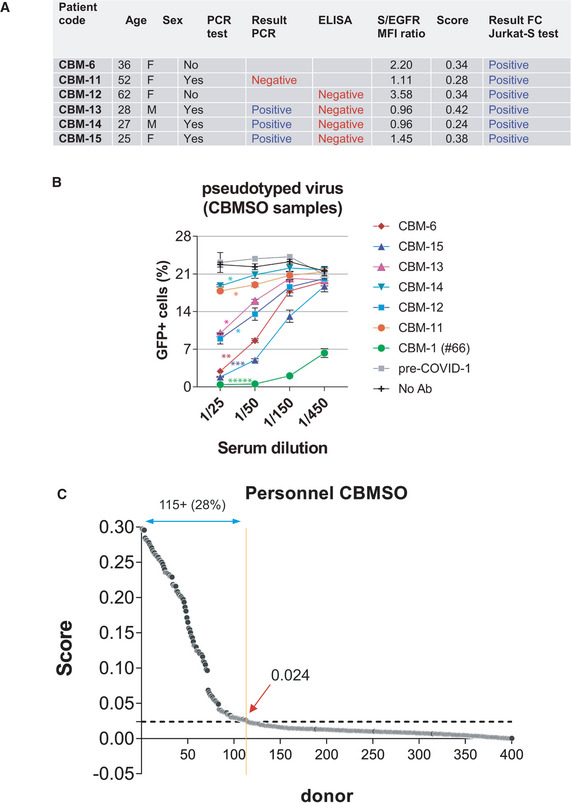
Figure 7. Prevalence of seropositivity by the FC Jurkat‐S method within a cohort of 415 samples.

- Discrepancies between the result of the flow cytometry test and previous PCR or ELISA tests within the CBMSO cohort.
- A neutralization assay with S protein‐pseudotyped lentivirus was carried out to resolve the discrepancies. Data represent the mean ± SD of duplicates. *P < 0.05; **P < 0.005; ***P < 0.0005; *****P < 0.000005 (paired two‐tailed t‐test comparing all serum dilutions to the pre‐COVID sample).
- Classification of the CBMSO cohort according to the Score generated from S/EGFR data. The broken line indicates the 0.024 threshold above which samples are considered positive.
