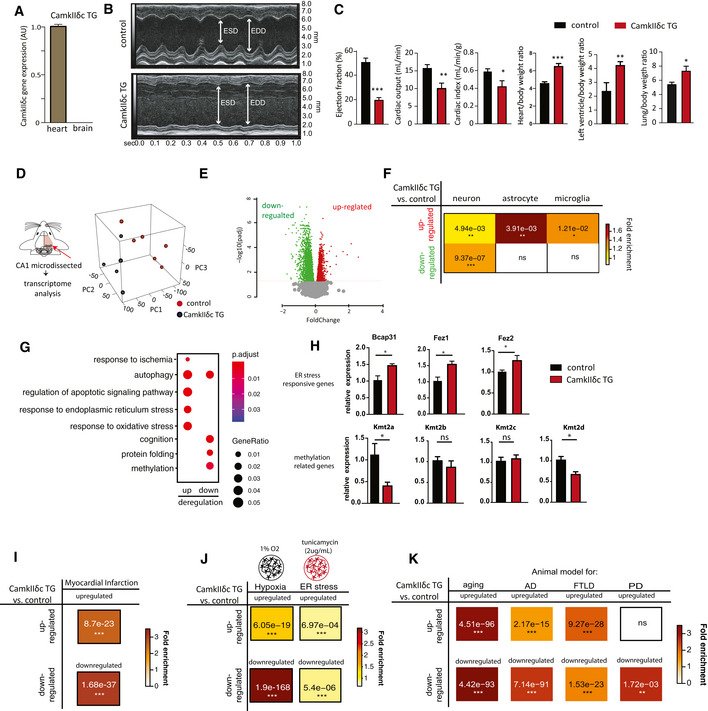
Figure 1. Heart failure in CamkIIδc TG mice is linked to aberrant hippocampal gene expression.

-
AqPCR data comparing the expression of the CamkIIδc transgene in the brain and heart of 3‐month‐old CamkIIδc TG mice; n = 4/group; *P < 0.05, Unpaired t‐test, two‐tailed. Note that the transgene is not detected in the brain.
-
BRepresentative M‐mode images from left ventricle from CamkIIδc TG and control mice. EDD, left ventricle diastolic diameter; ESD, left ventricle end‐systolic diameter.
-
CEjection fraction, cardiac output, and index are significantly decreased in CamkIIδc TG mice (n = 8) when compared to control mice (n = 5; *P < 0.05, **P < 0.01, ***P < 0.001, unpaired t‐test, two‐tailed). Heart to body ratio, left ventricle to body weight ratio, and lung to body weight ratio are increased in CamkIIδc TG (n = 8) compared to control (n = 5; *P < 0.05, **P < 0.01, unpaired t‐test; two‐tailed).
-
DExperimental scheme for RNA‐seq analysis that was performed from hippocampal CA1 region of CamkIIδc TG mice (n = 6) and control mice (n = 5) at 3 months of age. Right panel shows principal component analysis (PCA) of the gene expression data. The first principal component (PC1) can explain 42% of the variation between two groups.
-
EVolcano plot showing differentially expressed genes (FDR < 0.05). Red color indicates up‐regulation, while green represents down‐regulation of transcripts.
-
FHypergeometric overlap analysis comparing genes deregulated in CamkIIδc TG mice to genes uniquely expressed in neurons, astrocytes, or microglia. Numbers represent the P value after multiple adjustments with Benjamini–Hochberg (BH) method. Fisher's hypergeometric test; color represents fold enrichment.
-
GDot plot showing Top GO biological processes after removing redundant GO terms using Rivago.
-
HqPCR quantification of selected genes reflecting ER stress or protein methylation‐related processes in CamkIIδc TG mice (n = 4) and control mice (n = 5). *P < 0.05, ns, non‐significant, unpaired t‐test; two‐tailed. Data are normalized to Hprt1 expression.
-
I–KHypergeometric overlap analysis comparing genes deregulated in CamkIIδc TG mice to genes deregulated under (I) hypoxia conditions and (J) in response to tunicamycin‐induced ER stress and (K) in hippocampal tissue from animal models of memory impairment and neurodegeneration. Benjamini–Hochberg (BH) adjusted P values after are denoted as numbers, and fold enrichment is represented as color heatmap. Fisher's hypergeometric test.
Data information: Bars and error bars indicate average ± standard error mean.
