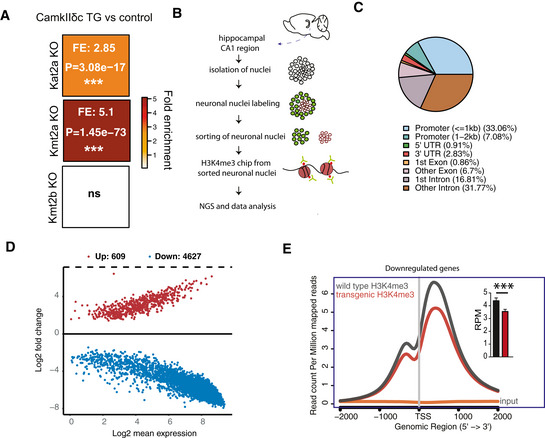
Figure 3. Neuronal H3K4m3 is impaired in the hippocampus of CamkIIδc TG mice.

- Hypergeometric overlap analysis comparing genes deregulated in CamkIIδc TG mice to genes differentially expressed in the hippocampal CA1 region of Kat2A, Kmt2A, and Kmt2b knockout mice. Fisher's hypergeometric test, Benjamini–Hochberg (BH) correction.
- Experimental scheme for ChIP‐seq analysis. NeuN + neuronal nuclei were FACS sorted and used to perform chromatin immunoprecipitation (ChIP) for H3K4me3.
- Pie chart showing the distribution of H3K4me3 peaks in the neurons of the hippocampal CA1 region from CamkIIδc TG mice.
- MA plot showing the number of significantly altered neuronal H3K4me3 peaks when comparing CamkIIδc TG and control mice.
- NGS plot showing H3K4me3 peaks at the TSS of genes down‐regulated in the hippocampus of CamkIIδc TG mice. Inset shows statistical analysis, (unpaired t‐test, two‐tailed, ***P < 0.001). Bars and error bars indicate mean ± SEM. H3K4me3 ChIP analysis was performed on four replicates/group.
