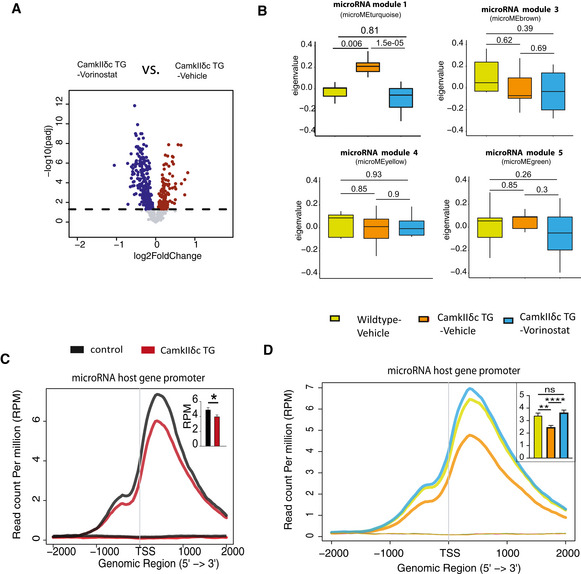
Figure EV5. Vorinostat‐induced microRNA expression changes in the hippocampal CA1 region of CamkIIδc TG mice.

- Volcano plot showing differentially expressed microRNAs (FDR < 0.05) when comparing Vorinostat‐treated to vehicle‐treated CamkIIδc TG mice.
- Expression of microRNA modules from WGCNA analysis in three experimental groups. Wild‐type vehicle: n = 9; CamkIIδc TG vehicle n = 7; CamkIIδc TG‐Vorinostat n = 10; Kruskal–Wallis test. In boxplot, the upper and lower band represent the third and first quartiles, respectively, while the center line indicates the median. The whiskers represent the smallest and largest values in the 1.5× interquartile range.
- H3K4me3 profile at promoter of genes that harbor microRNAs of microRNA module 2 (See Fig 5F). H3K4me3 level at the TSS of these genes is significantly reduced in CamkIIδc TG mice when compared to control mice. Inset shows statistical analysis; unpaired t‐test, two‐tailed, *P < 0.05. Bars and error bars indicate mean ± SEM. Number of replicates for H3K4me3 ChIP profile analysis (Wild‐type vehicle: 3; CamkIIδc TG vehicle n = 4; CamkIIδc TG‐Vorinostat n = 4).
- Comparison of H3K4me3 profile at the TSS of genes that harbor microRNAs of microRNA module 2 (same as panel C) among wild‐type Vehicle, CamkIIδc TG vehicle and CamkIIδc TG‐Vorinostat groups. Average H3K4me3 profile at promoter of microRNA host genes is down‐regulated in CamkIIδc TG vehicle, but restored in CamkIIδc TG‐Vorinostat mice. One‐way ANOVA; **P < 0.01, ****P < 0.0001. Bars and error bars indicate mean ± SEM. Number of replicates for analyzed H3K4me3 profile (Wild‐type vehicle: 3; CamkIIδc TG vehicle n = 4; CamkIIδc TG‐Vorinostat n = 4).
