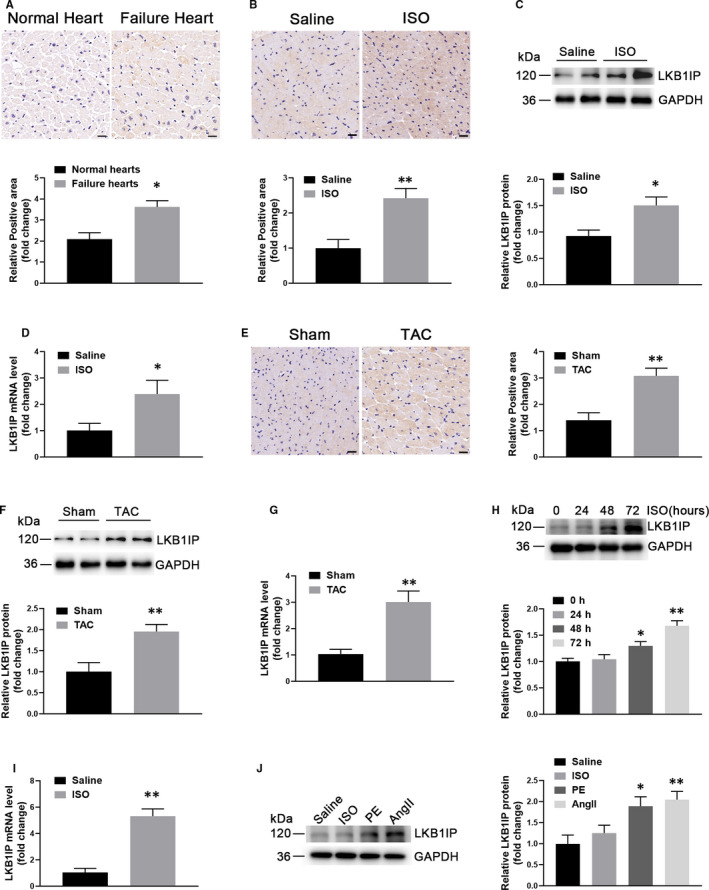
FIGURE 1.

LKB1IP expression is up‐regulated in hypertrophic hearts and cells. (A) Immunohistochemical staining of LKB1IP protein in heart tissue from normal human controls and heart failure patients (n = 5). *P < .05 vs normal control. Scale bar, 20 μm. (B) Immunohistochemical staining of LKB1IP protein in heart tissue from control and ISO‐induced hypertrophic mice (n = 5). **P < .01vs saline. Scale bar, 20 μm. (C) Western blot analysis of LKB1IP protein expression in control and ISO‐induced hypertrophic mouse hearts (n = 5). *P < .05 vs saline. (D) Quantitative PCR analysis of LKB1IP mRNA level from hearts of control and ISO‐induced cardiac hypertrophic mice (n = 5). *P < .05 vs saline. (E) Immunohistochemical staining of LKB1IP protein in mouse heart samples at 2 weeks after transverse aortic constriction (TAC) or sham surgery (n = 5). **P < .001 vs sham. Scale bar, 20 μm. (F) Western blot analysis of LKB1IP protein expression in control or TAC‐induced hypertrophic mouse hearts at 2 weeks (n = 4). **P < .01vs sham. (G) Quantitative PCR analysis of LKB1IP mRNA levels in hearts of sham and TAC‐induced cardiac hypertrophic mice (n = 4). **P < .01 vs sham. (H) Western blot analysis of LKB1IP protein expression in NRCMs treated with 10 μmol/L ISO at the indicated times (n = 3). *P < .05, **P < .01 vs 0 hr (I) Quantitative PCR analysis of LKB1IP mRNA level in the NRCMs treated with 10 μmol/L ISO for 48 hr (n = 3). **P < .01vs saline. (J) Western blot analysis of LKB1IP protein expression in NRCMs treated with 10 μmol/L ISO, 100 nmol/L AngII or 100 μmol/L phenylephrine (PE) for 24 hr (n = 3). *P < .05 **P < .01 vs saline
