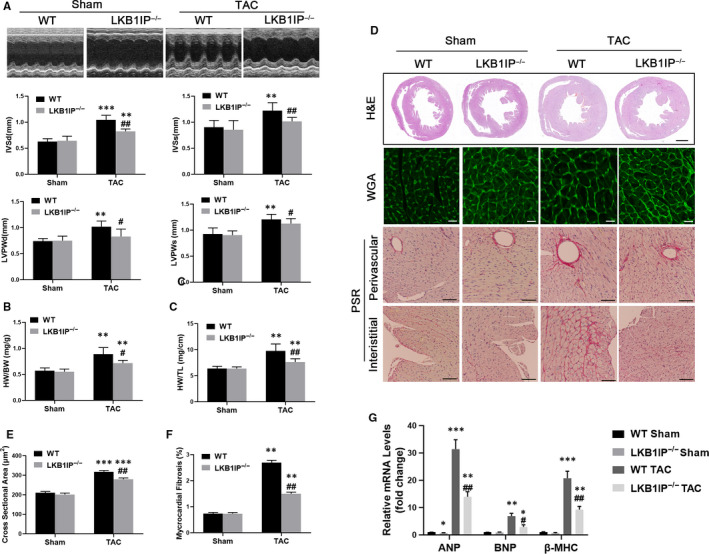
FIGURE 4.

LKB1IP deficiency alleviates TAC‐induced cardiac hypertrophy. (A) Representative M‐mode echocardiography of the left ventricle (top). Measurement of diastolic interventricular septal thickness (IVSd), systolic interventricular septal thickness (IVSs), diastolic left ventricular posterior wall (LVPWd) and systolic left ventricular posterior wall (LVPWs) in the indicated groups (n = 5). **P < .01,***P < .001 vs WT Sham; # P < .05, ## P < .01 vs WT TAC. Quantitative analysis of (B) ratio of HW/BW in the indicated groups (n = 5) and (C) ratio of HW/TL in the indicated groups (n = 5) **P < .01 vs WT Sham; # P < .05, ## P < .01 vs WT TAC. (D) Analysis of whole hearts (the first row; scale bar, 1,000 μm) and heart sections stained with WGA (the second row; scale bar, 50 μm) or PSR (the third and fourth rows; scale bars, 50 μm) in the indicated groups at 14 days after sham or TAC surgery. (E) Quantitative analysis of the average cardiomyocyte cross‐sectional area in the indicated groups, n > 100 cells per group. ***P < .001 vs WT Sham; ## P < .01 vs WT TAC. (F) Quantitative analysis of LV collagen volume in the indicated groups, n > 15 fields per group. **P < .01 vs WT Sham; ## P < .01 vs WT TAC. (G) Quantitative PCR analysis of ANP, BNP and β‐MHC mRNA levels in the indicated groups (n = 3). *P < .05, **P < .01, ***P < .001 vs WT Sham; # P < .05, ## P < .01 vs WT TAC
