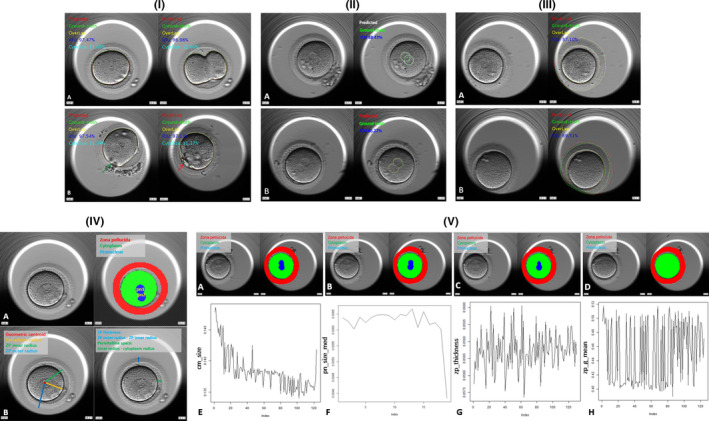
FIGURE 2.

(I) Illustration of the segmentation of cytoplasm: Red circles represented the predicted area, while the green circle represented the labelled area (ground truth). The yellow circle represented the overlap of labelled and ground truth. IoU and cytoplasm size (CytoSize) were shown in the left upper corner. In Figure 2‐I‐A, two images came from the same zygote. The one on the left was captured before cleavage while the one on the right is cleaving, which was an irregular shape. The performances of segmentation on these two images were over 95%. In Figure 2‐I‐B, on the left image, cumulus cells (green arrow) blocked a part of the cytoplasm edge while on the right image; a big PB blocked the edge of another cytoplasm. Nevertheless, the IoU in both images was over 97% indicating the noise robust of the proposed system. (II) Illustration of the segmentation of PN: Figure 2‐II‐A showed the segmentation of respective PN, and green circles represented the labelled area while the white circles represent the segmented area. We used white colour to distinguish the type of segmentation with Figure 2‐II‐B. The average IoU of Figure 2‐II‐A was 88.43%. Figure 2‐II‐B showed the segmentation of fusion PN. The boundaries between PN were blurred so the labelled area was considered as the whole green circle and the segmented area was the whole red circle, correspondingly. The IoU of Figure 2‐II‐B was 86.22%. (III) Illustration of the segmentation of ZP: Figure 2‐III‐A showed the example of high precision (87.10%) segmentation of ZP. The green circle represented the labelled area, while the red circle represented the segmented area. Only a small part of the ZP was blocked by the edge of the well (from seven o’clock position to nine o’clock position). Figure III‐B showed the example of low precision (69.51%) segmentation of ZP. More than one‐fourth ZP was blocked by the edge of the well (from five o’clock position to nine o’clock position). Moreover, the ZP in seven o’clock position was hardly seen, which was not available for labelling by the embryologists or precise segmentation by the proposed system. (IV) Illustration of the calculation of zygote morphokinetic parameters: Figure 2‐IV‐A left was an original image captured by time‐lapse incubator and Figure 2‐IV‐A right was the pixelated and segmented one. The pixels belonged to ZP were labelled in red; the pixels belonged to cytoplasm were labelled in green, and the pixels belonged to PN were labelled in blue. It was easy to notice that if a pixel belonged to one of the structures but not located at the edge, all its neighbours were the pixels in the same colour. To distinct the PN, we defined the one closer to the centroid of cytoplasm as pn1, and the other as pn2. Figure 2‐IV‐B left showed the centroid (red), cytoplasm radius (yellow), ZP inner radius (green) and outer radius (blue). Figure 2‐IV‐B right showed the calculation of ZP thickness and perivitelline space. (V) Examples of time series of the morphokinetic parameters: Figure 2‐V‐A, B, C and D were the examples of the original and segmented time‐lapse images from a zygote. Figure 2‐V‐A represented the beginning frame captured right after fertilization check. Figure 2‐V‐B was the middle frame between Figure 2‐V‐A and Figure 2‐V‐D. Figure 2‐V‐C was the beginning of PN fusion. Figure 2‐V‐D was the frame right after PN fading. Figure 2‐V‐E, F, G and H gave examples of time series data of the zygote morphokinetic parameters. Figure 2‐V‐E was the cm_size, and it had a significant trend of decrease from the beginning to the end. Figure 2‐V‐F was the pn_size_mean. It was static before fusion, and its value sharply decreased when fusion began. Figure 2‐V‐G was the zp_thickness. Though it fluctuated, it did not have a significant trend. Figure 2‐V‐H was the zp_g_mean. Similar to Figure 2‐V‐G, though the value fluctuated, it was no trend on it. Both these two parameters were stationary
