
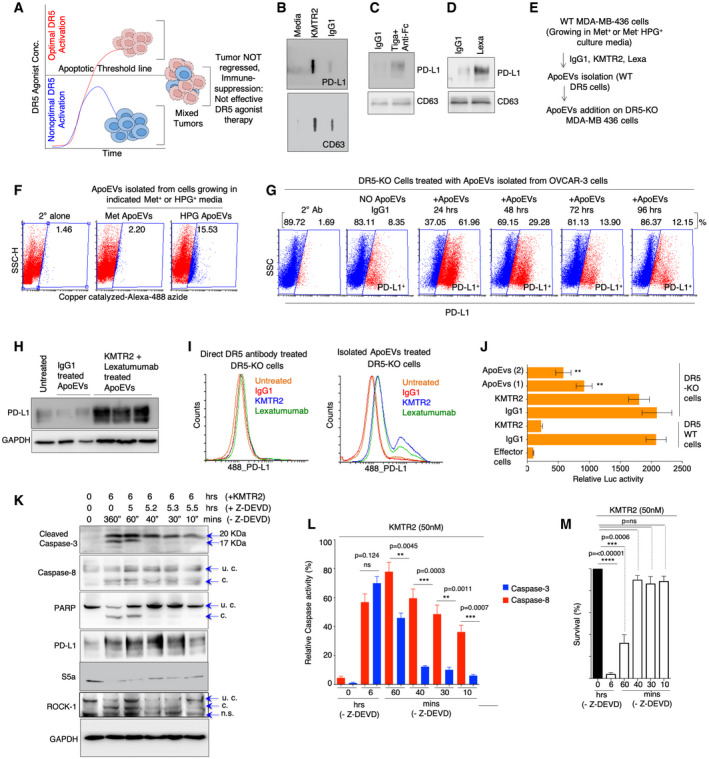
Figure 3. ApoEVs and non‐apoptotic caspase‐8 help stabilize PD‐L1 in DR5 insensitive tumor cells.
-
ASchematic showing presence of tumor cells capable of optimal and non‐optimal apoptotic activation by DR5 agonists constitute heterogeneous tumors.
-
B–DApoEVs isolated after IgG1 and KMTR2 treatment (OVCAR‐3) were blotted against CD63 and PD‐L1 in dot blots. ApoEVs isolated after IgG1 and tigatuzumab (C) and lexatumumab (D) treatment (MDA‐MB‐436) were run on western and blotted against CD63 and PD‐L1.
-
EDetails of experimental data described in (F).
-
FApoEVs isolated from DR5‐sensitive tumor cells grown in Met‐HPG+ media were added on to DR5‐KO cells (growing in regular media). After 48 h flow cytometry analysis was carried out with HPG catalyzing dye. HPG incorporation (3rd plot, see Methods for more details) from flow cytometry data confirms ApoEV transfer from cells growing in Met‐HPG+ (DR5‐WT) to DR5‐KO cells.
-
GApoEVs isolated from DR5‐WT OVCAR‐3 cells (KMTR2 treated) were added on to DR5‐KO (MDA‐MB‐231) cells for indicated times (24–96 h) to analyze PD‐L1 transfer kinetics from ApoEVs (see also Appendix Fig S6).
-
HSame as (G) except after addition of MDA‐MB‐436‐derived ApoEVs (treated with combination of KMTR2 + lexatumumab DR5 agonists or IgG1) on to DR5‐KO MDA‐MB‐231 cells, total lysates were immunoblotted for PD‐L1 after 24 h. KMTR2 + lexatumumab (n = 3), IgG1 (n = 2).
-
ILeft: PD‐L1 surface histogram shows direct antibody treatment on DR5‐KO cells. Right: PD‐L1 surface histogram from DR5‐KO cells after treatment (24 h) with ApoEVs isolated from DR5‐sensitive cells after either Lexa or KMTR2 treatment.
-
JSame as (H and I) except ApoEVs treated tumor cells were analyzed in PD‐1 reporter co‐culture assays for luciferase signal (n = 3; see Fig 2).
-
KMDA‐MB‐436 cells were treated with KMTR2 for 6 h and along with Z‐DEVD for indicated times. Z‐DEVD shows final time of KMTR2 exposure to cells in the absence inhibitor. Lysates were immunoblotted for cleaved caspase‐3, 8, PARP, PD‐L1, S5a, ROCK1 and GAPDH (n = 3). u.c: uncleaved, c: cleaved, n.s: non‐specific band.
-
LRelative caspase‐8 and caspase‐3 activity assays from (K). Similar to cleaved caspase‐8 profile in (K), caspase‐8 maintained steady activity, while caspase‐3 activity required at least 40 (+) mins of DR5 agonist treatment without Z‐DEVD (n = 3).
-
MAfter indicated treatments with KMTR2 (DR5 agonist) and Z‐DEVD (caspase‐3 preferred inhibitor) similar to (K and L), cells were allowed to grow 24 h, followed by cell viability analysis.
Data information: Error bars in (J) represent SD. Error bars in (L) and (M) represent SEM. For statistical significance, t‐test was used for (J), (L), and (M; **P < 0.005, ***P < 0.0001, ****P < 0.00005).
Source data are available online for this figure.