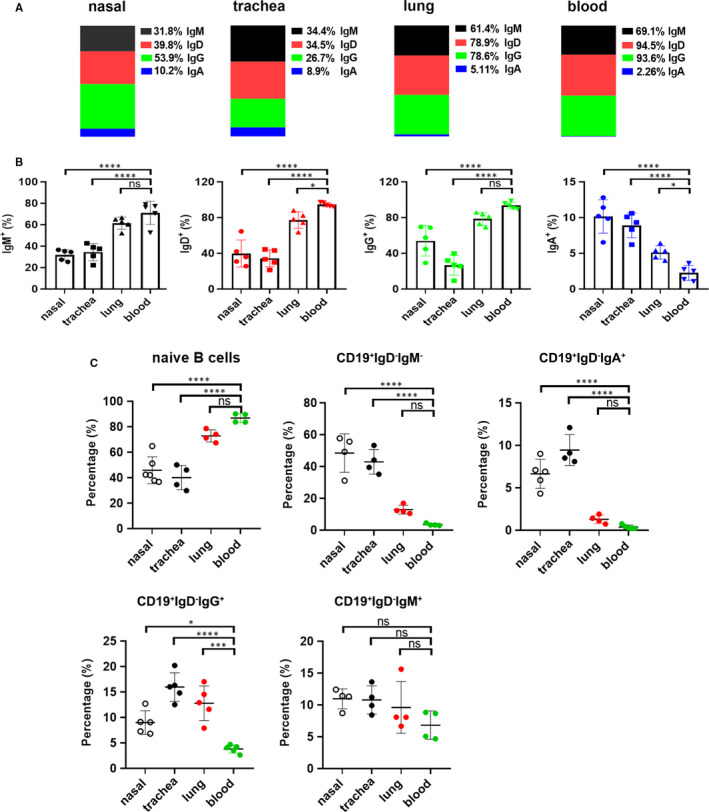
FIGURE 3.

Expression difference of surface Igs on non‐circulating B cells from nasal, trachea, lung tissues and circulating B cells from blood. (A) The representative diagram showed the means of IgM (black), IgD (red), IgG (green) and IgA (blue) expression on live and singlet non‐circulating B cells in nasal, trachea, lung tissues and circulating B cells in blood. (B) Statistical results represented five independent experiments by seven mice each group. (C) The cells from nasal, trachea and lung tissues were gated on live and singlet non‐circulating lymphocytes, and the frequencies of naïve B cells, CD19+IgD‐IgM‐, CD19+IgD‐IgA+, CD19+IgD‐IgG+ and CD19+IgD‐IgM+ cells were analysed by flow cytometry, respectively. Statistical charts from four independent experiments by seven mice each group were shown. Data were compared with Dunnett's multiple comparisons test of one‐way ANOVA. *P < 0.05, ***P < 0.001; ****P < 0.0001; ns, no significance
