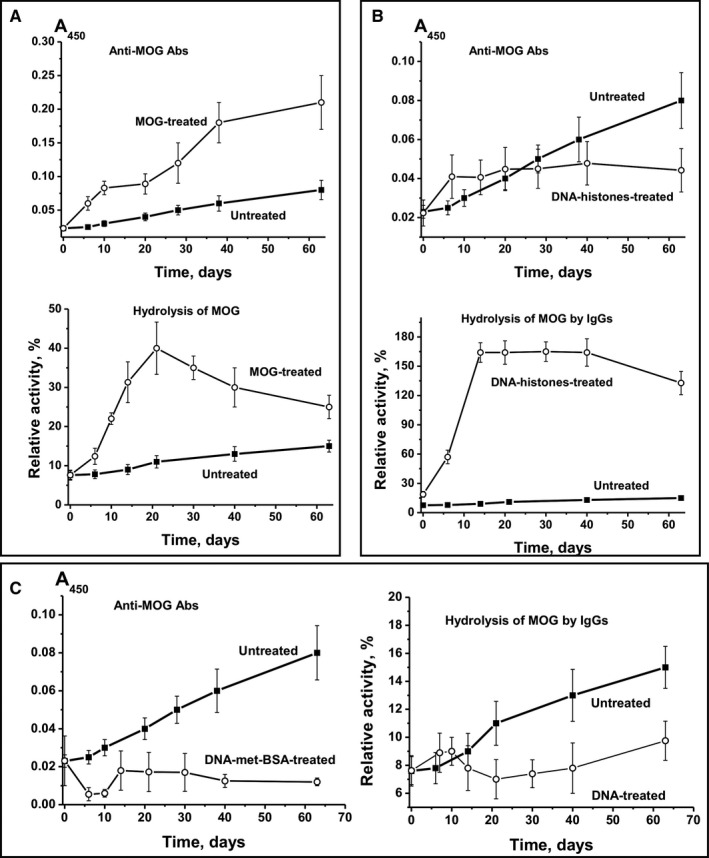
Figure 3.

Time‐dependent changes in average values of anti‐MOG Ab concentration and relative activity of IgG hydrolysing MOG after immunization of mice with MOG (A), DNA‐histone complex (B) and DNA‐met‐BSA complex (C). For comparison, data on parameter changes during spontaneous development of EAE are given
