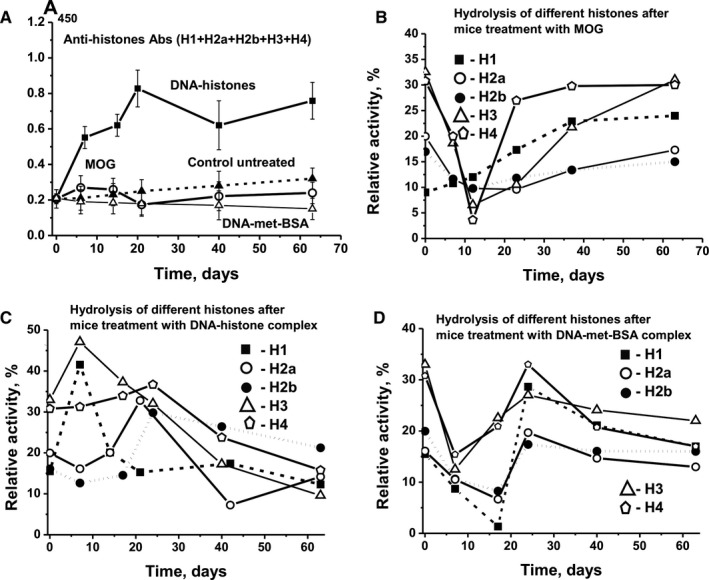
Figure 5.

Time‐dependent changes in average values of anti‐histone Ab concentration (A) and relative activity of IgG hydrolysing five different histones (H1, H2a, H2b, H3 and H4) after immunization of mice with MOG (B), DNA‐histone complex (C) and DNA‐met‐BSA complex (D). The error in determining the value corresponding to each time‐point does not exceed 10%‐12%
