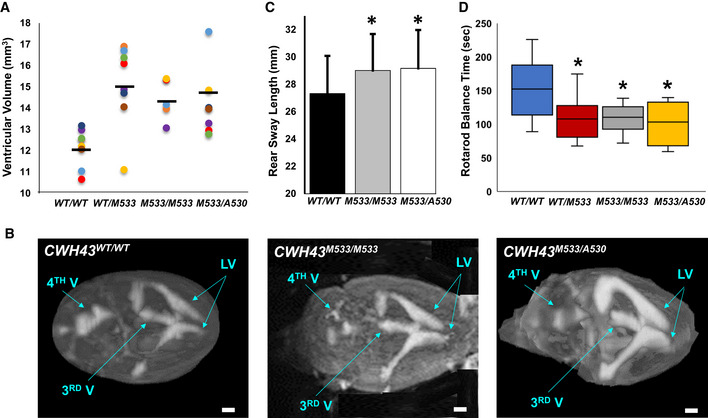
Figure 3. CWH43 mutation increases ventricular volume and causes gait dysfunction in mice.

- Scatter plot comparing ventricular volume from CWH43WT/WT (wild‐type, WT), heterozygous CWH43WT/M533, homozygous CWH43M533/M533, and CWH43M533/A530 mice at 6 months. Ventricular volume was calculated from T2‐weighted MR images of the mouse brain using a custom automated computer algorithm. Horizontal bars indicate the mean of the measurements in each column. Statistical significance for each mutant mouse line compared to WT was determined using the unpaired t‐test (P = 0.0015 for CWH43WT/M533; P = 0.0014 for CWH43M533/M533; P = 0.006 for CWH43M533/A530).
- Representative 3D volumetric MR images of mouse brains from 6‐month‐old CWH43WT/WT, CWH43M533/M533, and CWH43M533/A530 mice. LV = lateral ventricle, 3rd V = third ventricle, 4th V = fourth ventricle. Scale bar is approximately 1 mm.
- Quantitative gait analysis at 7 months of age revealed increased sway among homozygous CWH43M533/M533 mice, (*P = 0.03, n = 5) and compound heterozygous CWH43M533/A530 (*P = 0.034, n = 4) mice when compared to wild‐type CWH43WT/WT mice (n = 5). Sway (the distance between the hind paws during walking) was measured repeatedly for individual mice in each group during a constrained unidirectional walk. Data shown are the mean ± SD for each group. Statistical significance was determined using the unpaired t‐test.
- Box plot showing rotarod performance data for CWH43WT/WT, CWH43WT/M533, CWH43M533/M533, and CWH43M533/A530 mice at 7 months of age. Data shown are the mean, 1st quartile, 3rd quartile, minimum, and maximum for each group of mice. Statistical significance was determined using the unpaired t‐test. When compared to wild‐type CWH43WT/WT mice (n = 10), balance time on the rotarod was decreased significantly among heterozygous CWH43WT/M533 mice (*P = 0.04, n = 8), homozygous CWH43M533/M533 mice (*P = 0.03, n = 7), and compound heterozygous CWH43M533/A530 mice (*P = 0.03, n = 4).
Source data are available online for this figure.
