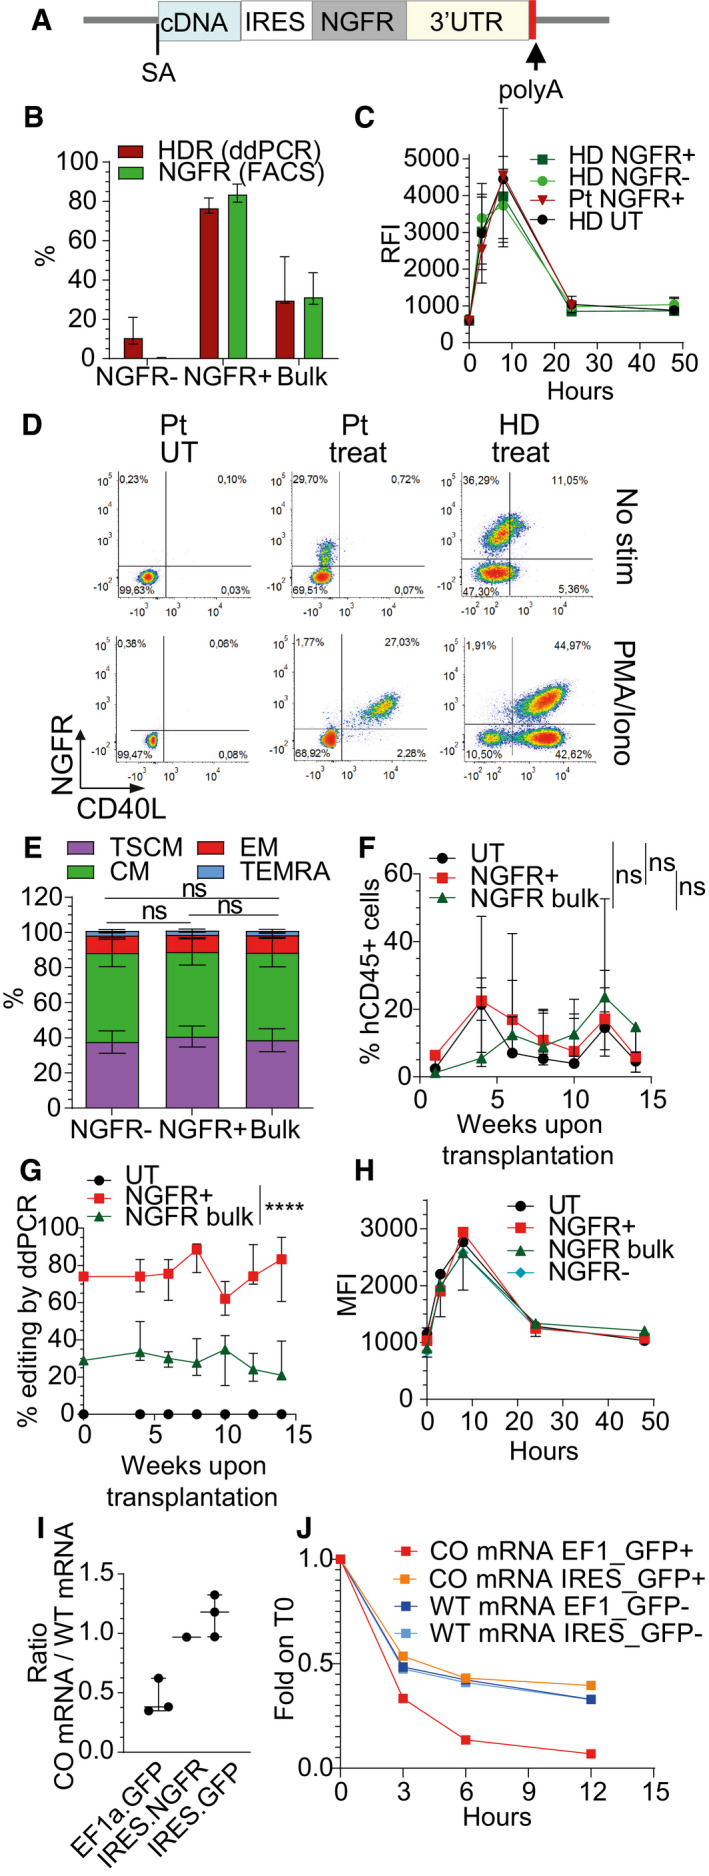
Figure 2. Edited cells enrichment and increased CD40L expression level by adding NGFR selector to the therapeutic gene.

- Schematics of donor DNA template used for edited cells enrichment.
- Percentage of NGFR+ cells or HDR at 17 days after CD40LG editing of male HD bulk edited, sorted NGFR+ or sorted NGFR− CD4+ T cells (n = 7 for each group). Median ± IQR.
- Time course of CD40L surface expression after PMA/Ionomycin stimulation measured by RFI (normalized to T0) on UT (n = 2), edited (NGFR+) or unedited (NGFR‐) HD or Pt derived CD4+ T cells (n = 4 HD, 1 Pt). Median ± IQR.
- Representative plots showing CD40L and NGFR expression in UT or bulk edited (Treated) CD4+ T cells derived from male HD or Pt from (C) before and 8 h after PMA/Ionomycin stimulation.
- Population composition in male HD bulk edited, sorted NGFR+ or sorted NGFR−CD4+ T cells from (B) (n = 7 for each group). Friedman test (to account for the same donor) with P‐values adjusted with Bonferroni’s correction to account for multiple testing. Mean ± SEM.
- Human CD45+ cell engraftment in PB after transplantation of male HD UT (n = 5), bulk edited (NGFR bulk; n = 5) or sorted NGFR+ (n = 5) CD4+ T cells. Longitudinal comparisons were performed with an LME model, followed by an appropriate post hoc analysis (see Appendix Supplementary Statistical Methods). The reported statistical comparisons refer only to the overall difference among groups. Median ± IQR.
- Percentage of HDR within human cells over time, measured by ddPCR in PB of mice from (F) (n = 5 for each group, measured in engrafted mice with sufficient blood material). Longitudinal comparisons were performed with an LME model with time treated as a continuous variable (see Appendix Supplementary Statistical Methods). UT group was not included in the analysis. Effect of the time and the eventual different effect of the time in the groups were not retained in the final model after backward variable selection, highlighting a constant (and significantly different, ****P < 0.0001) behavior of the groups over time. Median ± IQR.
- Time course of CD40L surface expression after PMA/Ionomycin stimulation measured by MFI on pooled CD4+ T cells retrieved from spleens of mice from (F) (n = 1 for each group, except for NGFR‐ unedited group, n = 3). Median ± IQR.
- Dot plot depicting the ratio between expression of CD40LG edited mRNA (codon‐usage optimized, CO) and CD40LG wild‐type mRNA (WT) in cells edited with three different donor templates from Fig EV2H. Three independent experiments (n = 3 EF1a.GFP, 1 IRES.NGFR, 3 IRES.GFP). Median ± IQR.
- Time course of expression of WT‐CD40LG mRNA or CO‐CD40LG mRNA, measured as fold change (FC) on IPO8 housekeeping gene and normalized to T0. Sorted edited (+) and sorted unedited (−) CD4+ T cells were analyzed before and 3, 6, and 12 h after Actinomycin D treatment (n = 1 for each group).
Source data are available online for this figure.
