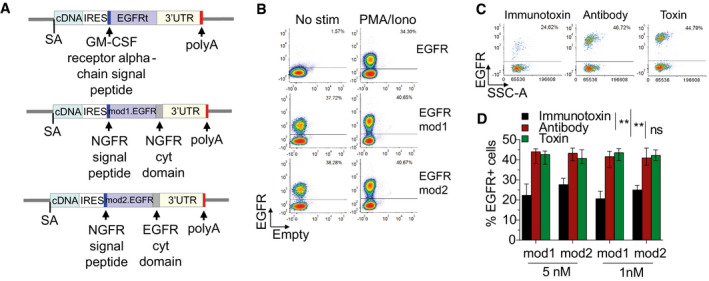
Figure 3. Selection and depletion of the edited T cells by exploiting an optimized hEGFRt gene.

- Schematics of donor DNA templates carrying corrective cDNA coupled to IRES sequence and hEGFRt selector genes.
- Representative plots showing hEGFRt expression in bulk edited CD4+ T cells derived from male HD before and 8 h after PMA/Ionomycin stimulation. Cells were edited with the three constructs depicted in (A).
- Representative plots showing EGFR expression in bulk edited CD4+ T cells derived from male HD at 3 days after treatment with immunotoxin (left), antibody (middle), or toxin (right).
- Bar plot showing percentage of EGFR+ T cells at 3 days after treatment with 5 nM or 1 nM of immunotoxin, antibody, or toxin, measured by FACS Analysis. Friedman test with Dunn’s multiple comparisons. P‐values were adjusted with Bonferroni’s correction to account for multiple comparisons (**P = 0.0052 and **P = 0.0024 for immunotoxin vs. antibody and **P = 0.0010 and **P = 0.0024 for immunotoxin vs. toxin, referring to EGFRmod1 and EGFRmod2, respectively). Different dose conditions were used as a unified group for statistical analysis (n = 10 for each group). Median ± IQR.
Source data are available online for this figure.
