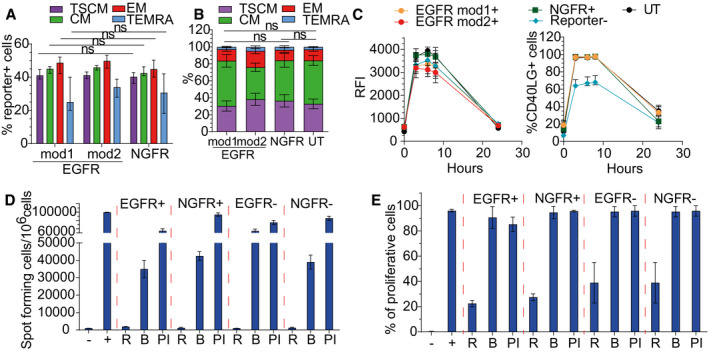
Percentage of Reporter+ cells within T‐cell subpopulations at 17 days after CD40LG editing in male HD‐derived CD4+ T cells, measured by FACS analysis. Cells were edited with donor templates carrying NGFR (n = 7), EGFRmod1 (n = 7), or EGFRmod2 (n = 4). Paired Wilcoxon’s test (to account for the same donor) with P‐values adjusted with Bonferroni’s correction to account for multiple testing. EGFRmod2 was not included in the analysis because n = 4. Median ± IQR.
Population composition in male HD‐derived UT T cells (n = 14) or bulk edited T cells from (A). Comparisons were performed by estimating an LME model for each subpopulation, accounting for the same donor and different replicates per donor within group, followed by a post hoc analysis performed with the R package phia. P‐values were adjusted with Bonferroni’s correction for both multiple testing and multiple comparisons. In the analysis of the subpopulations, TSCM and TEMRA, the percentages were used in natural logarithmic scale to meet the assumption of normality of the residuals of the models. EGFRmod2 was not included in the analysis because n = 4. Mean ± SEM.
Time course of CD40L surface expression after PMA/Ionomycin stimulation measured by RFI (normalized to Reporter− cells; left) and percentage (right) on UT, edited, or unedited T cells from (A) (n = 4 for each group, except for Reporter−
n = 12). Median ± IQR.
IgG+ secreting B cells, evaluated by ELISPOT assay. B cells were isolated from PB of HD and co‐cultured with male HD sorted NGFR/EGFR+ and NGFR/EGFR−, resting (R) or stimulated with beads (B) or PMA/Ionomycin (PI). B cells cultured alone (−) or in presence of sCD40L (+) were used as negative and positive controls, respectively (n = 2 for each group). Mean ± SEM.
Analysis of B‐cell proliferative capacity by Cell Trace dilution assay in allogeneic sorted B cells isolated from PB of HD and co‐cultured with male HD T cells from (D). B cells cultured alone (−) or in presence of sCD40L (+) were used as negative and positive controls, respectively (n = 2 for each group). Mean ± SEM.

