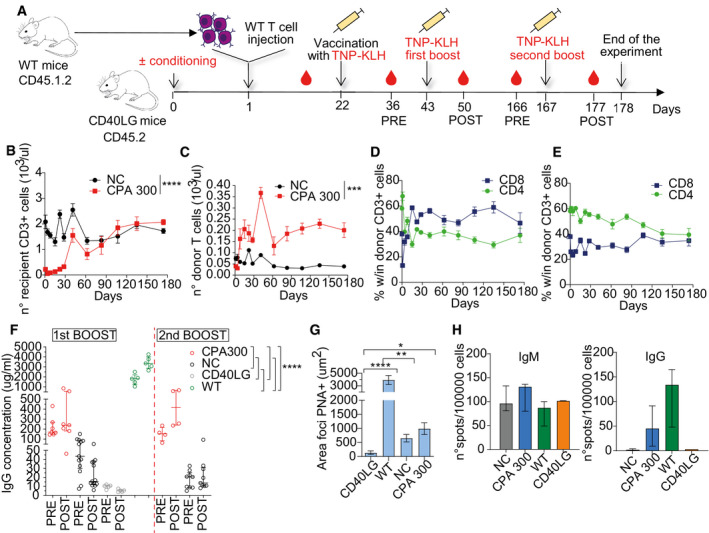
Figure 5. Partial rescue of the IgG response by adoptive transfer of naive functional T cells in Cd40lg −/− mice.

-
ASchematics of adoptive transfer of spleen derived CD45.1.2+CD3+ WT T cells (donor) into CD45.2 Cd40lg −/− mice (recipient) pre‐conditioned with 300 mg/kg CPA or not (NC) and immune response studies.
-
BTotal counts of recipient CD3+ cells gated within CD45.2+ cells in PB of experimental mice (n = 4 CPA 300, 9 NC). Comparison between groups was performed by NLME model with an asymptotic model (see Appendix Supplementary Statistical Methods). The reported statistical comparisons refer only to day 1 (****P < 0.0001). Mean ± SEM.
-
CTotal counts of engrafted donor CD45.1.2+ cells in PB of mice from (B). Comparison between groups was performed by NLME model with an asymptotic model (see Appendix Supplementary Statistical Methods). The reported statistical comparisons refer only to plateau (***P = 0.0001). Mean ± SEM.
-
D, EPercentage of donor CD4+ and CD8+ cells gated within CD3+CD45.1.2+ cells in PB of CPA treated (D) or NC mice (E) from (B). Mean ± SEM.
-
FTNP‐KLH‐specific IgG in sera of transplanted mice collected at the times indicated in (A) (n = 7 CPA 300, 13 NC for first boost and 4 CPA 300, 9 NC for second boost). Sera from vaccinated WT (n = 5) and CD40lg −/− (n = 5) mice were used as positive and negative controls, respectively. Two independent experiments. Comparisons of first boost data were performed with an LME model, accounting for multiple experiments, followed by appropriate post hoc analysis (see Appendix Supplementary Statistical Methods). The reported statistical comparisons refer only to the overall difference among groups (****P < 0.0001 in all comparisons). Median ± IQR.
-
GAverage area of PNA+ foci in splenic sections of experimental mice from (B), calculated as ratio between total PNA+ area and number of PNA+ foci/cells. Kruskal–Wallis test followed by post hoc analysis with Dunn’s test (n = 9 CD40LG, 6 WT, 18 NC, 8 CPA300). P‐values were adjusted with Bonferroni’s correction to account for multiple comparisons (*P = 0.0149, **P = 0.0065 and ****P < 0.0001). Mean ± SEM.
-
HDetection of splenic TNP‐KLH‐specific IgM (left) and IgG (right)‐secreting cells by ELISPOT assay (n = 7 NC, 4 CPA300, 3 WT, 2 CD40LG). Spots were counted by an ELISPOT Reader using a size range of 0.005–1 mm. Median ± IQR.
Source data are available online for this figure.
