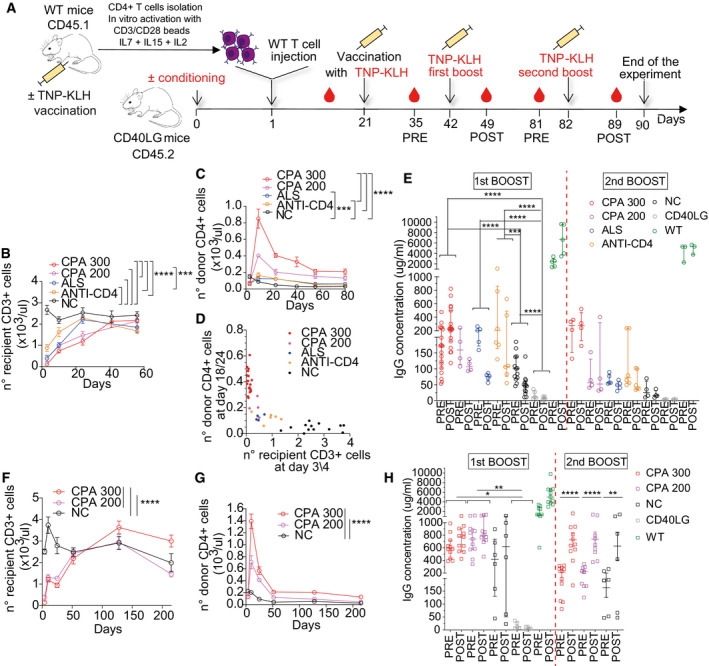
Figure 6. Rescue of humoral immune response by adoptive transfer of ex vivo cultured and in vivo primed donor T cells.

- Schematics of adoptive transfer of in vitro activated WT CD45.1+CD4+ T cells into CD45.2 Cd40lg −/− mice pre‐conditioned or not with different lymphodepleting regimens and immune response studies.
- Total counts of recipient CD3+CD45.2+ cells in PB of mice NC (n = 13) or pre‐conditioned with 300 mg/kg CPA (n = 19), 200 mg/kg CPA (n = 6), anti‐lymphocyte serum (ALS; n = 5), or anti‐CD4 antibody (n = 6). Three independent experiments. Comparisons at day 3/4 were performed with an LME model, accounting for multiple experiments, followed by appropriate post hoc analysis (see Appendix Supplementary Statistical Methods; ***P = 0.0009 and ****P < 0.0001 in all comparisons). Mean ± SEM.
- Total counts of engrafted donor CD45.1+ cells in PB of mice from (B). Three independent experiment. Comparisons at day 18/24 were performed with an LME model, accounting for multiple experiments, followed by appropriate post hoc analysis (see Appendix Supplementary Statistical Methods; ***P = 0.0002 and ****P < 0.0001 in all comparisons). CPA200 was not included in the analysis because n = 4. Mean ± SEM.
- Analysis of the relationship between total counts of recipient CD3+ cells gated within CD45.2+ cells at day 3, 4, and engrafted donor CD45.1+ T cells at 18/24 days. This relationship was modeled with an asymptotic NLME model (Appendix Supplementary Statistical Methods), accounting for the different groups and multiple experiments. From the estimated model, a lower value of recipient CD3+ T cells corresponds to a higher value of engrafted donor CD4+ T cells (P = 0.0006).
- TNP‐KLH‐specific IgG concentration in sera of mice from (B) collected before (day 35; pre) and after (day 49; post) the first boost (n = 13 NC, 19 CPA 300, 4 CPA 200, 5 ALS, 6 ANTI‐CD4; three independent experiments) and at day 81 (pre) and 89 (post) for the second boost (n = 4 NC, 4 CPA 300, 4 CPA 200, 5 ALS, 6 ANTI‐CD4). Sera from vaccinated WT (n = 5) and Cd40lg −/− (n = 5) mice were used as positive and negative controls, respectively. For early challenge data, comparisons were performed with an LME model, accounting for multiple experiments, followed by appropriate post hoc analysis (see Appendix Supplementary Statistical Methods). The reported statistical comparisons refer only to the overall difference among groups (***P = 0.0002 and ****P < 0.0001 in all comparisons). CPA200 was not included in the analysis because n = 4. WT group, not indicated in the figure, is significantly different from all groups (P < 0.0001 in all comparisons). Of note, regarding the comparisons between time‐points, the groups CPA 300 and WT show a significant increase between pre‐ and post‐values (P < 0.0001 for both), while all other groups show a significant decrease between pre‐ and post‐values (P < 0.0001 for all except P = 0.0022 for ANTI‐CD4). Median ± IQR.
- Total counts of recipient CD3+ cells gated within CD45.2+ cells after transfer of primed donor T cells in PB of mice treated with 300 mg/kg CPA (n = 11), 200 mg/kg CPA (n = 11) or NC (n = 6). Longitudinal comparisons were performed by LME model followed by an appropriate post hoc analysis (Appendix Supplementary Statistical Methods). The reported statistical comparisons refer only to day 4 (****P < 0.0001 in all comparisons). Mean ± SEM.
- Total counts of engrafted donor CD45.1+ cells in PB of mice from (F). Longitudinal comparisons were performed with an LME model followed by an appropriate post hoc analysis (Appendix Supplementary Statistical Methods). The reported statistical comparisons refer only to day 25. At day 215, a significant difference was observed between CPA 300 vs. NC and CPA 300 vs. CPA 200 (****P < 0.0001 for both). Mean ± SEM.
- TNP‐KLH‐specific IgG concentration in sera of mice from (F) collected before (day 36, pre) and after (day 50, post) the first boost (n = 6 NC, 11 CPA 300, 11 CPA 200) and at day 212 (pre) and 219 (post) for the second boost (n = 6 NC, 11 CPA 300, 9 CPA 200). Sera from vaccinated WT (n = 11) and Cd40lg −/− (n = 5) mice were used as positive and negative controls, respectively. Comparisons were performed with an LME model followed by an appropriate post hoc analysis, separately for each challenge data (Appendix Supplementary Statistical Methods). Reported statistical comparisons refer to the overall difference among groups, for early challenge data (*P = 0.0282 and **P = 0.0037), while to differences between time points within each group, for late challenge data (**P = 0.0018 and ****P < 0.0001 in both comparisons). Of note, in the late challenge data, no significant overall differences were observed among the groups. Median ± IQR.
Source data are available online for this figure.
