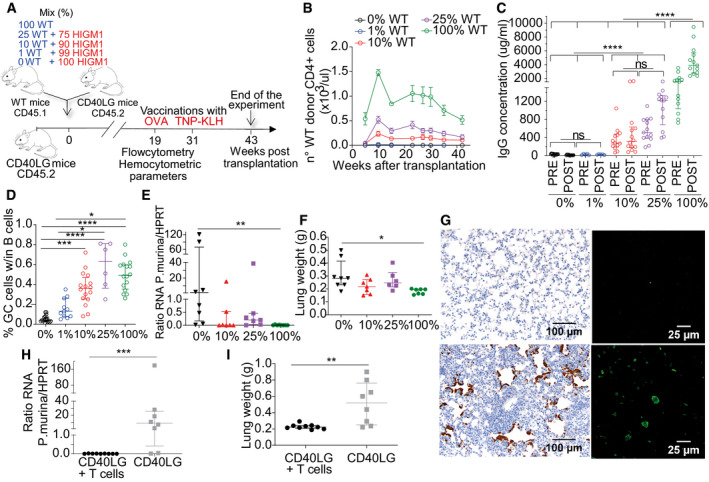
Figure 7. CD40LG editing efficiencies achieved in HSPC provide comparable immune rescue as adoptive T‐cell transfer.

- Schematics of competitive transplant at different ratios of WT (blue) and Cd40lg −/− HSPC (red) (100% WT, 25% WT, 10% WT, 1% WT, 0% WT) into lethally irradiated Cd40lg −/− recipients.
- Total counts of WT donor CD4+ T cells in mice from (A) (n = 13 100% WT, 8 25% WT, 14 10% WT, 6 1%, 14 0% WT). Two representative experiments shown out of 3. Mean ± SEM.
- TNP‐KLH‐specific IgG concentration in sera of mice from (A) collected 7 days before (pre) and after (post) TNP‐KLH vaccination (n = 13 100% WT, 13 25% WT, 14 10% WT, 6 1% WT, 14 0% WT). Three independent experiments. Comparisons were performed with an LME model, accounting for multiple experiments, followed by an appropriate post hoc analysis (Appendix Supplementary Statistical Methods). The reported statistical comparisons refer only to the overall difference among groups (****P < 0.0001 in all comparisons). Median ± IQR.
- Percentage of PNA+GL7+ GC B cells within the spleen of mice from (A) (n = 16 100% WT, 6 25% WT, 16 10% WT, 11 1% WT, 18 0% WT). Kruskal–Wallis test followed by post hoc analysis with Dunn’s test. P‐values were adjusted with Bonferroni’s correction to account for multiple comparisons (*P = 0.0385 for 25% WT vs. 1% WT, *P = 0.0129 for 100% WT vs. 1% WT, ***P = 0.0001 and ****P < 0.0001 in both comparisons). Median ± IQR.
- Quantitation of P. murina rRNA in lung homogenate of mice from (A) transplanted with different ratios of WT HSPC cells (n = 8 100% WT, 7 25% WT, 7 10% WT, 8 0% WT) and infected with the pathogen. Results are expressed in P. murina/HPRT RNA copies. Kruskal–Wallis test followed by post hoc analysis with Dunn’s test. P‐values were adjusted with Bonferroni’s correction to account for multiple comparisons. Only the groups 100% WT and 0% WT resulted to be significantly different (**P = 0.0028). Median ± IQR.
- Lung weight of mice from (E). Kruskal–Wallis test followed by post hoc analysis with Dunn’s test. P‐values were adjusted with Bonferroni’s correction to account for multiple comparisons. Only the groups 100% WT and 0% WT resulted to be significantly different (*P = 0.0254). Median ± IQR.
- Left: Representative pictures of lung tissue sections stained immunohistochemically with a rabbit primary antibody (upper left: negative sample; lower left: positive sample). Brown areas represent intra‐alveolar aggregates of P. murina organisms. Right: Representative pictures of P. murina organisms detected by immunofluorescence in lungs homogenate (upper right: negative sample; lower right: positive sample).
- Quantitation of P. murina rRNA in lung homogenate of mice adoptively transferred (n = 9 CD40LG+ T cells) or not (n = 8 CD40LG) with in vivo primed CD4+ T cells in absence of conditioning and infected with the pathogen. Results are expressed in P. murina/HPRT RNA copies. Mann–Whitney test. ***P‐value of the comparison = 0.0003. Median ± IQR.
- Lung weight of experimental mice from (H). Mann–Whitney test. **P‐value of the comparison = 0.0055. Median ± IQR.
Source data are available online for this figure.
