Figure 1.
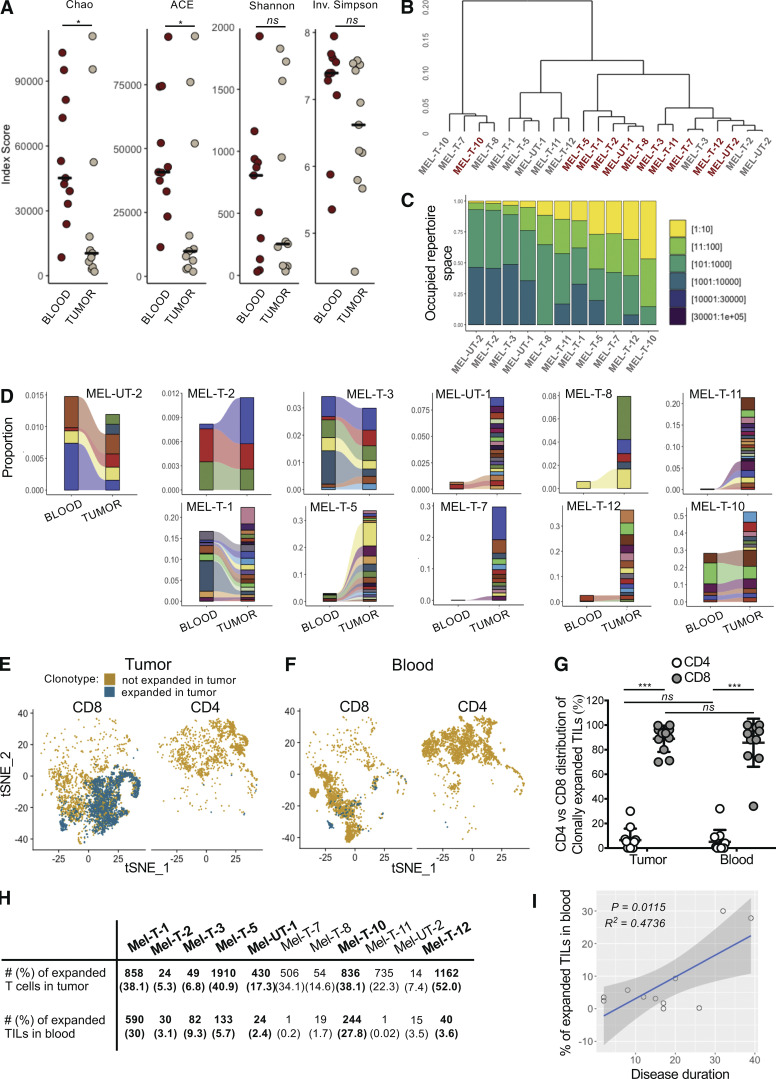
Detection of clonally expanded TILs in the circulation of melanoma patients. (A) Dot plots displaying indexes of diversity and species richness for tumor and blood TCRαβ repertoires of melanoma patients. Each dot represents one patient. Horizontal bars indicate medians. Statistical significance was determined using Wilcoxon rank sum test (ns, P ≥ 0.05; *, P < 0.05). (B) Hierarchical clustering of tumor and blood TCRαβ repertoires based on clonal size distribution. Red, blood; gray, tumor. (C) Bar graph displaying the proportion of TCRαβ repertoire space occupied by the top n clonotypes (bins in legend) for the tumor samples of individual patients. (D) Alluvial plots displaying the frequency of the top 20 most-expanded TIL clonotypes in blood and tumor for individual patients. (E and F) tSNE plot of TILs (E) and circulating T cells (F) divided by expression of CD8A (normalized counts >1) and CD4 (normalized counts >1) for one representative patient. T cells expressing TCRs expanded in the tumor are highlighted in blue. (G) Percentage of CD4+ (white) and CD8+ (gray) T cells among clonally expanded T cells in tumor and circulating TILs. Each data point represents the average for one patient. Data represent mean ± standard deviation. Statistical significance was determined using t test with Bonferroni-Dunn correction for multiple comparisons (ns, P ≥ 0.05; ***, P < 0.001). (H) Table displaying the absolute number and frequency of tumor-resident and blood-derived CD8 T cells expressing a TCR expanded in the tumor for each patient. Bold indicates patients in whom the absolute number of blood-derived T cells with a TCR expanded in the tumor (circulating TILs) was deemed large enough for subsequent analyses. (I) Scatter plots showing the relationship of the frequency of circulating TILs and disease duration. Adjusted R2 and F test P values are shown.

