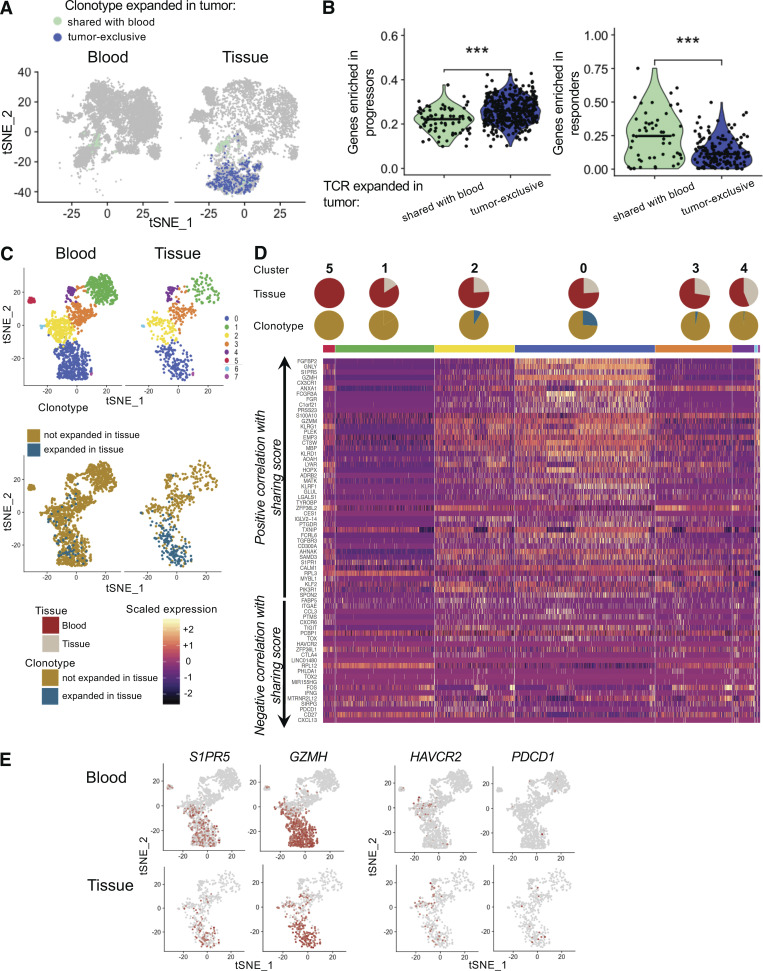
Figure 5.
Features associated with blood–tumor sharing are highly expressed in the tissue of two patients who responded to immunotherapy. (A) tSNE plots of blood and tumor T cells from patient Mel-UT-1 highlighting tumor-infiltrating cells with a TCR clonally expanded in the tumor and tumor-exclusive (dark blue) or shared with blood (aqua). (B) Quantification of the expression of gene sets associated with response to immunotherapy or progression as described by Sade-Feldman et al. (2018) in tumor-resident cells indicated in A. Statistical significance was determined using Wilcoxon rank sum test (***, P < 0.001). (C) Top: tSNE plot of CD8 T cells from two patients, split by tissue of origin and colored by cluster. Clustering was obtained with an SNN modularity optimization-based algorithm (k parameter = 5, resolution = 0.5). Bottom: tSNE plot of CD8 T cells from two patients, split by tissue of origin and colored by expression of a TCR expanded in tissue (blue) or not (gold). (D) Heatmap of genes previously established to be positively and negatively correlated with TCR sharing score at an adjusted log (P value) less than or equal to −100 (as in Fig. 5 A). Rows represent genes grouped by correlation with TCR sharing. Columns represent individual cells grouped by cluster identity (horizontal bars), with clusters ordered by decreasing percentage of blood cells. Values are scaled and mean-centered log2-transformed gene counts. Pie charts stacked on top of the grouping color bar indicate tumor versus blood composition and expanded TIL composition for each cluster. (E) tSNE plot of CD8 T cells from two patients, split by tissue of origin and colored by scaled expression of the indicated genes.

