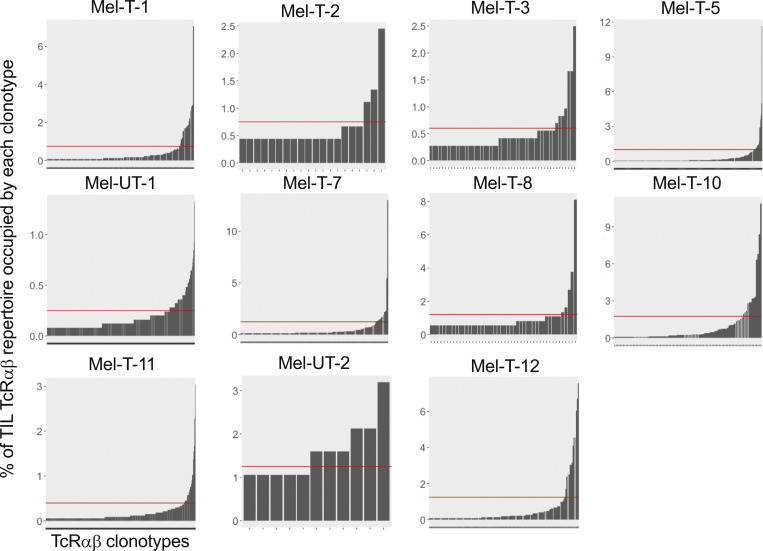
Figure S1.
Individual thresholds of clonal expansion in the tumor. Bar graphs displaying the frequency of TILs expressing a given TCRαβ clonotype on the y axis and individual TIL clonotypes ordered by increasing frequency on the x axis, for individual patients. Red horizontal lines represent individualized thesholds of expansion.

