Figure S3.
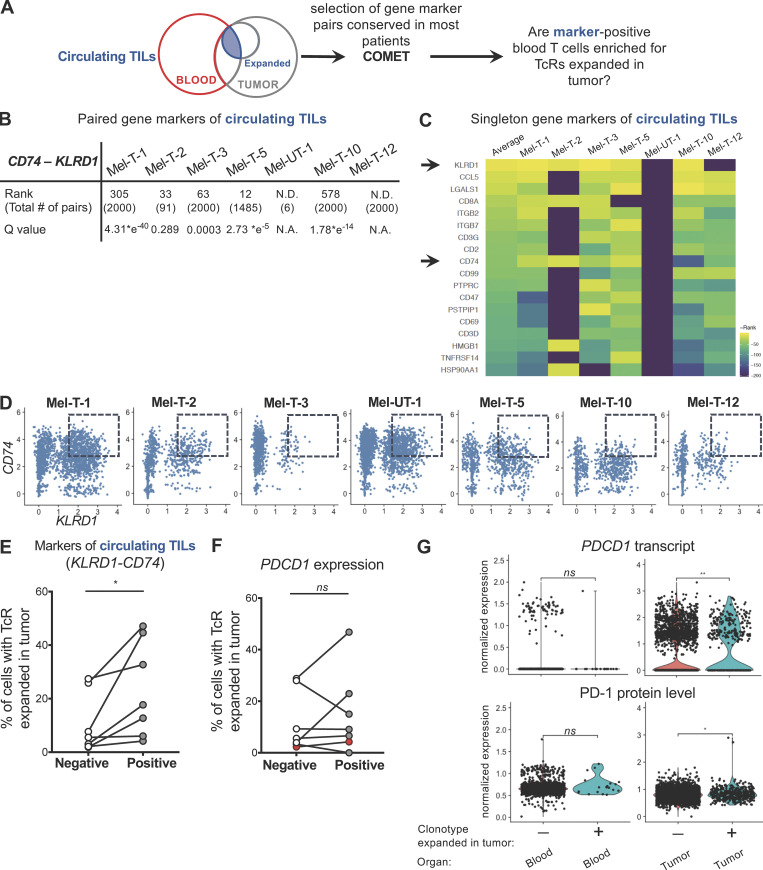
Coexpression of KLRD1 and CD74 enriches for circulating TILs. (A) Workflow for identification of gene markers of circulating TILs. Singleton and paired gene markers of circulating TILs were identified from the blood of each patient using COMET. Gene marker pairs detected in most patients were chosen, and blood T cells were classified based on coexpression of the selected gene markers. The percentages of circulating TILs in cells positive and negative for the selected gene markers were compared for each patient. (B) Table summarizing the rank of the gene marker pair KLRD1-CD74, the q value, and the total number of gene marker pairs identified by the COMET analysis. N.D. indicates that the gene marker pair KLRD1-CD74 was not detected in that patient. (C) Heatmap of the reverse rank (rank * −1, rows) of singleton gene markers of circulating TILs that were shared by at least five out of seven patients (columns), ordered by the average across patients. For pairs not detected in a specific patient, a reverse rank of −200 was assigned. Arrows indicate KLRD1 and CD74, detected by both the singleton and the paired gene marker analyses. (D) Scatter plots displaying the relationship between the integrated (Stuart et al., 2019) expression of KLRD1 and CD74 transcripts in each patient. Dashed boxes indicate double-positive cells, with expression of KLRD1 ≥ 1.5 and CD74 ≥ 3. (E) Percentage of cells expressing a TCR expanded in the tumor among cells that are positive or negative for the KLRD1-CD74 combination in each patient. (F) Percentage of cells expressing a TCR expanded in the tumor among cells that are positive or negative for PDCD1 expression in each patent. Red dots correspond to sample Mel-UT-1. Statistical significance was determined using paired t tests (ns, P ≥ 0.05; *, P < 0.05). (G) RNA-level (top) and protein level (bottom) expression of PD-1 in blood and tumor T cells from patient Mel-UT-1, grouped by clonotype expanded in the tumor or not. For RNA data, normalization was done by log transformation. For CITE-seq data, normalization was done by centered log-ratio. Statistical significance was determined using Wilcoxon rank sum test (ns, P ≥ 0.05; *, P < 0.05; **, P < 0.01).

