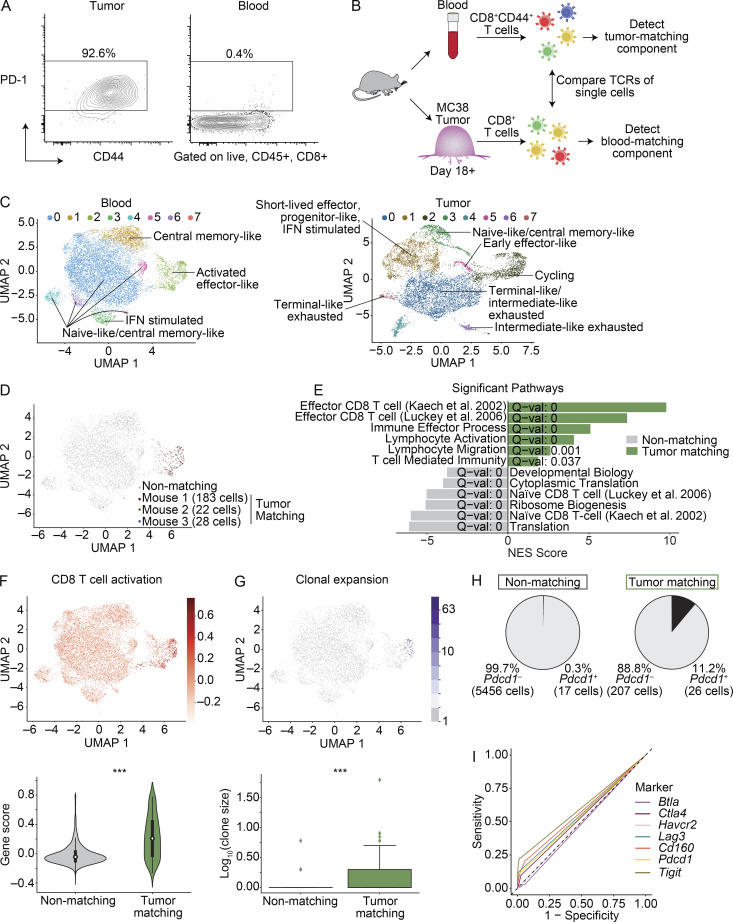
Figure 1.
scRNAseq of CD8+ T cells identifies MC38 TM clones in blood based on TCR sequence. (A) FACS plots showing PD-1 and CD44 protein in MC38 tumors and paired blood on day 21. Gated on singlets, live, CD45+, CD8α+ cells. Frequency of parent expressing PD-1 indicated. Data representative of four experiments, each with n = 5–9 mice. (B) Experimental design for scRNAseq. (C) Clustering and UMAP visualization of paired blood (n = 10,289 cells) and MC38 tumors (n = 8,450 cells) on day 18+, integrated from three mice (M1–3) from two experiments. Colors denote transcriptional clusters, labeled with functional annotations. (D) UMAP showing CD8+ T cells in blood that have a TCR matching to CD8+ T cells found in tumor (TM cells), colored by each mouse. Gray indicates non-TM cells. (E) Selected signatures associated with genes up-regulated in TM cells or non-TM cells in blood. Significance using a gene set enrichment analysis PreRanked analysis. Full list in Table S3. ((F) UMAP showing a CD8+ activation signature in blood (top). Violin plots of enrichment (bottom). Significance using a Wilcoxon rank sum test, P = 1 × 10−41. ***, P < 0.001. (G) UMAP showing clonal expansion in the blood (top). Box plot quantifying clonal expansion (bottom). Boxes show the first quartile, median, and third quartile, while the whiskers cover 1.5× the interquartile range. Significance using a Wilcoxon rank sum test, P = 4.6 × 10⁻⁷. (H) Frequency of Pdcd1+ cells in the blood. (I) ROC curve showing the sensitivity and specificity of Pdcd1, Btla, Ctla4, Havcr2, Lag3, Cd160, or Tigit to distinguish TM cells from non-TM cells. AUC values: Pdcd1 = 0.548, Btla = 0.486, Ctla4 = 0.535, Havcr2 = 0.500, Lag3 = 0.556, Cd160 = 0.574, and Tigit = 0.603. The dashed line represents the sensitivity and specificity values of random chance. (C–I) scRNAseq integrated from three biological replicates (M1–3) from two experiments.

