Figure 2.
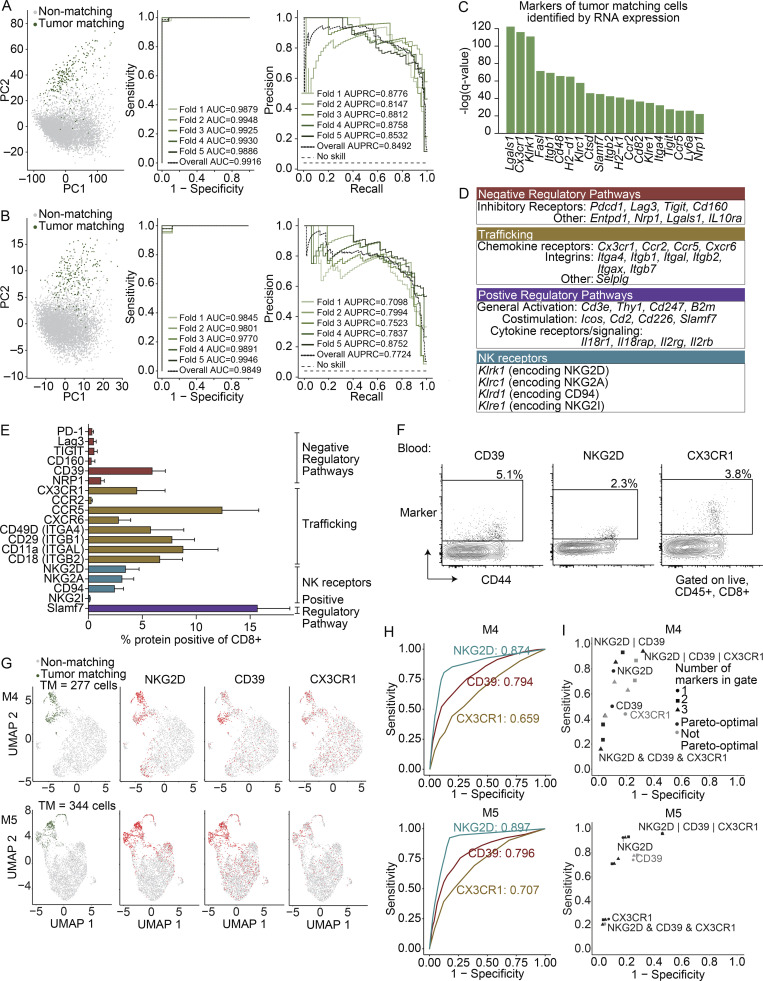
Cell surface marker panels can enrich TM cells from blood. (A and B) Logistic regression showing classification of cells as TM or non-TM based on (A) all genes and (B) a selected list enriched for surface-marker genes (Chihara et al., 2018). Shown are the first two principal component projections (left), ROC curves (middle), and the recall–precision plots (right) with fivefold cross validation. (C) Top 20 surface markers by q value for identifying TM cells in the blood using COMET. Significance using an XL-minimal hypergeometric test with multiple hypothesis test corrections. Full list in Table S4. (A–C) scRNAseq integrated from three biological replicates (M1–3) from two experiments. (D) Biological functions for positive markers (q value ≤ 0.01) identified using COMET for TM cells. NK, natural killer. (E) Frequency protein+ of CD8+ T cells in the blood of mice with MC38 tumors at day 21 (n = 9 mice) by flow cytometry. Gated on singlets, live, CD45+, CD8α+. Representative of two to four independent experiments depending on the marker, each with n = 5–9 mice. Bars show the mean, and error bars represent SD. NK, natural killer. (F) FACS plots showing CD39, NKG2D, and CX3CR1 (y axis) as indicated above each plot, and CD44 (x axis) on CD8+ T cells in the blood of mice in E. (G) UMAP visualization of mice from the validation cohort, two biological replicates, mouse 4 (M4), and mouse 5 (M5). Far left shows cells colored by matching status (green, TM; gray, non-TM). The three UMAPs to the right show cells colored by protein (NKG2D, CD39, and CX3CR1) using CITE seq (red, positive; gray, negative). Significance: CD39, P = 3.87 × 10−54 and P = 7.53 × 10−71; NKG2D, P = 3.19 × 10−122 and P = 1.93 × 10−175; CX3CR1, P = 9.22 × 10⁻¹⁷ and P = 2.08 × 10⁻³⁰ for M4 and M5, respectively, assessed using Wilcoxon rank sum test. (H) ROC curves showing the sensitivity and specificity of each protein at identifying TM cells. (I) Sensitivity and specificity for proteins in identifying TM cells as single markers or two- and three-protein combinations, colored black if they are pareto-optimal (no other gate with strictly better sensitivity and specificity) and gray if not pareto-optimal. The “&” indicates an “and” gate, and the “|” indicates an “or” gate. Full list of values in Table S5. (G–I) Two biological replicates from the validation cohort (one experiment).

