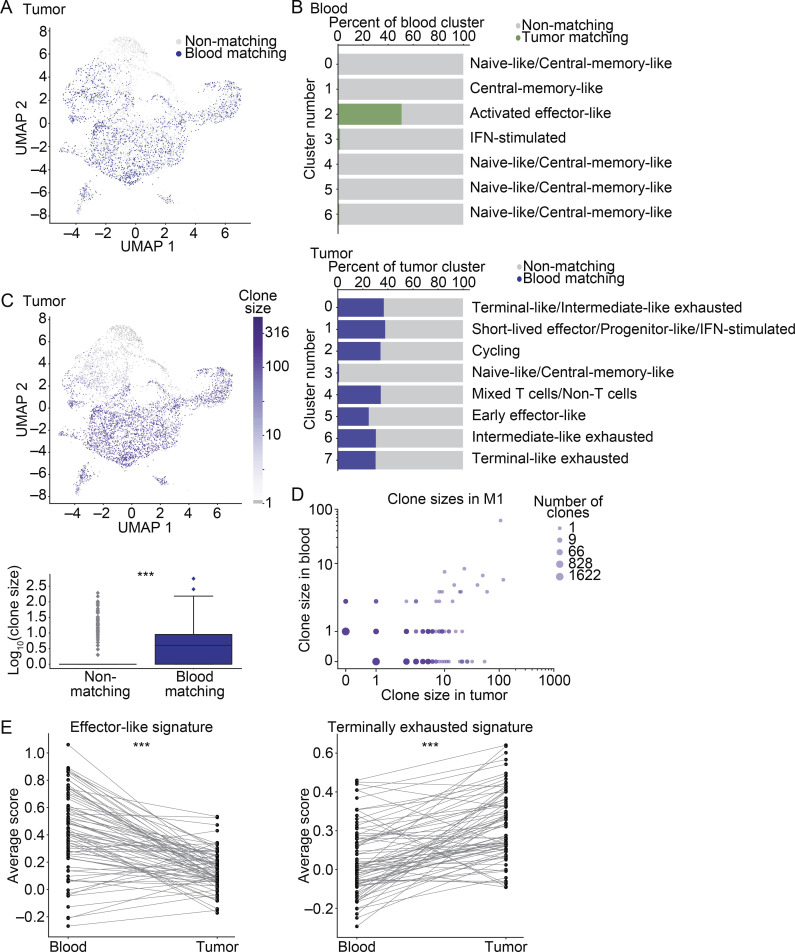
Figure 3.
TM CD8+ T cells in blood are less dysfunctional than the corresponding clones in tumor. (A) CD8+ T cells from the integrated MC38 tumor samples colored by matching status. Navy blue, blood-matching cells; gray, nonmatching cells. (B) The distribution of cells in blood (top) and MC38 tumors (bottom). Shown is the percentage of each cluster that is matching versus nonmatching. Shown are clusters with >50 cells. (C) UMAP visualization showing clone size across in tumor (top). Box plot quantifying clonal expansion in the tumor (bottom). Significance using the Wilcoxon rank sum test, P = 4.9 × 10⁻²⁶. (A–C) scRNAseq integrated from three biological replicates (M1–3) from two experiments. (D) Expansion rates of clones in blood and MC38 tumor (log-scale, for M1). Shown is M1 (one experiment), analysis of M4 and M5 from an independent experiment shown in Fig. S3 A. (E) Enrichment scores for a terminal exhaustion signature (P = 1.9 × 10⁻⁹) and an effector-like signature (P = 1.3 × 10⁻⁹) in tumor and blood. Significance using a Wilcoxon signed-rank test. Each dot shows the average gene signature of the cells in a given clone, and lines connect the same clone between tissues. Shown are clones detected in M1 (one experiment). M2 and M3 from an independent experiment shown in Fig. S3 D. ***, P < 0.001.

