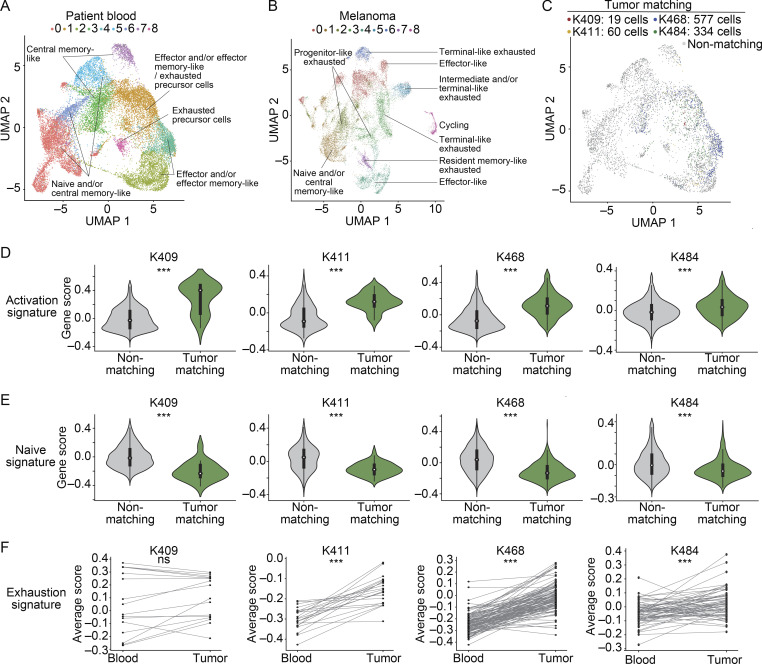
Figure 4.
TM CD8+ T cell clones can be detected in the blood of metastatic melanoma patients and show fewer signs of dysfunction than matching clones in tumor. (A and B) Clustering and UMAP visualization of paired blood (n = 21,833 cells) and tumor (n = 16,878 cells) samples from immunotherapy treatment naive patients, filtered to show CD8+ T cells. Data are integrated from four patients (four experiments, patient clinical parameters in Fig. S4 A and Table S7). Colors indicate transcriptional clusters. Functional annotations of each cluster are indicated. (C) CD8+ T cells in blood colored by matching status in each patient (color, TM; gray, non-TM). (D and E) Enrichment of activation (D) or naive (E) CD8+ T cell signatures. Significance using a Wilcoxon rank sum test. For D, P values are K409, P = 7 × 10⁻⁸; K411, P = 3.3 × 10⁻¹⁵; K468, P = 3.2 × 10−101; K484, P = 3.4 × 10⁻¹³. For E, P values are K409, P = 1.4 × 10⁻⁷; K411, P = 2.3 × 10⁻¹⁰; K468, P = 1.6 × 10−91; K484, P = 1.4 × 10⁻¹². (F) Mean value of an exhaustion signature in blood and in tumor. Significance using a Wilcoxon signed-rank test; P values are K409, P = 0.2; K411, P = 4 × 10⁻⁵; K468, P = 8.9 × 10⁻¹⁹; K484, P = 6.7 × 10⁻⁵. Each dot shows a clone, and lines connect the same clone between tissues. For patients, “tumor” refers to resections from the primary tumor and/or metastases as indicated in Fig. S4 B. (D–F) Four independent experiments. ***, P < 0.001; ns, not significant.

