Figure S1.
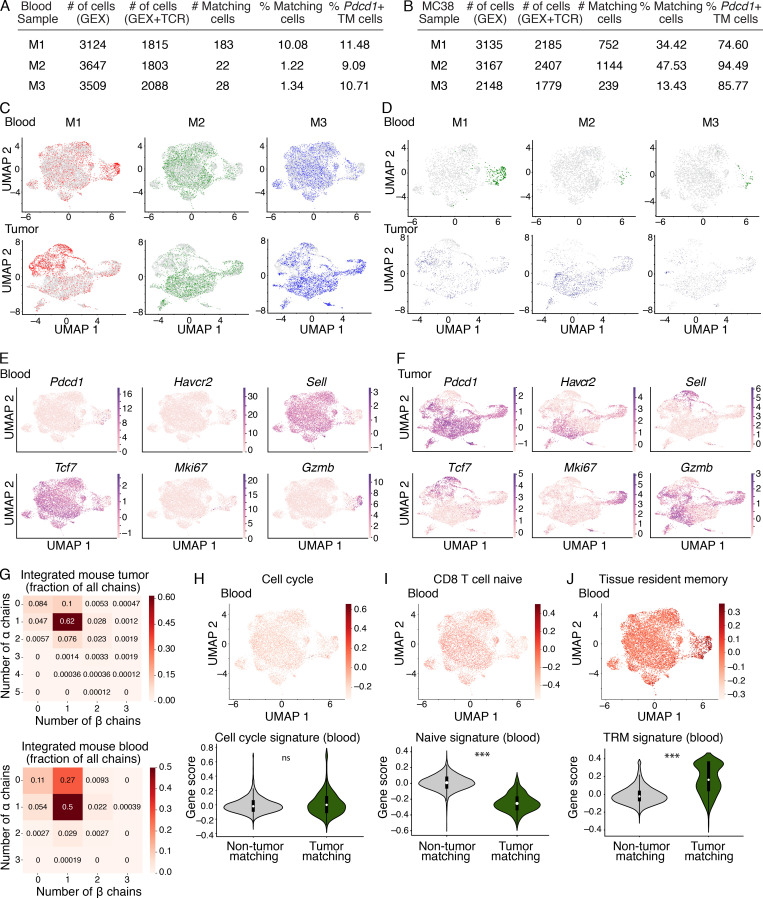
Transcriptional landscape of CD8+ T cells in paired peripheral blood and MC38 tumors in mice. (A and B) Tables indicating details about each mouse in the discovery cohort (M1–3), including the number of cells recovered that had gene expression (GEX) data, GEX and TCR data, number of matching cells, percentage matching cells of the total sorted population, and the frequency of Pdcd1+ TM cells in peripheral blood (A) and MC38 tumors (B). The samples from M1, M2, and M3 were integrated to generate an integrated blood sample and an integrated MC38 tumor sample as a discovery cohort. These three biological replicates were generated between two independent experiments (M1, experiment 1; M2 and M3, experiment 2). (C) UMAP of the integrated blood samples (top) and MC38 tumor samples (bottom) showing the distribution of each mouse in the integrated dataset (datasets combined from M1, M2, and M3). Cells from each mouse are shown in color (M1, red; M2, green; M3, blue), and the cells from the other two mice are shown in gray for each plot. (D) UMAP of the integrated blood samples (top) and MC38 tumor samples (bottom) showing the distribution of clones shared between tissues (TM cells in blood, and blood-matching cells in tumor). Only TM cells (green), blood-matching cells (navy blue), and nonmatching cells (gray) from each individual mouse are shown, and the cells from the other two mice in the integrated object are excluded. (E and F) UMAPs showing distribution of expression of select transcripts in the integrated blood (E) and MC38 tumor (F) samples. Genes include Pdcd1 (encoding PD-1), Havcr2 (encoding Tim-3), Sell (encoding CD62L), Tcf7 (encoding TCF-1), Mki67 (encoding Ki-67), and Gzmb (encoding granzyme B). (G) Heatmap showing the fraction of cells in the integrated MC38 tumor (top) and blood (bottom) datasets with the indicated number of TCR α and β chains detected. (H–J) Top: UMAP of integrated blood samples showing expression of a cell cycle signature (Kowalczyk et al., 2015; P = 0.24; H), a CD8+ naive T cell signature (Kaech et al., 2002; P = 4.6 × 10−125; I), and a TRM signature (Beura et al., 2018; P = 5.5 × 10−60; J). Violin plots quantifying the expression of each signature in H–J in TM compared with non-TM cells in the blood (bottom). ***, P < 0.001; ns, not significant. Significance determined using Wilcoxon rank sum tests. (C–J) scRNAseq integrated from three biological replicates (M1–3) between two independent experiments.

