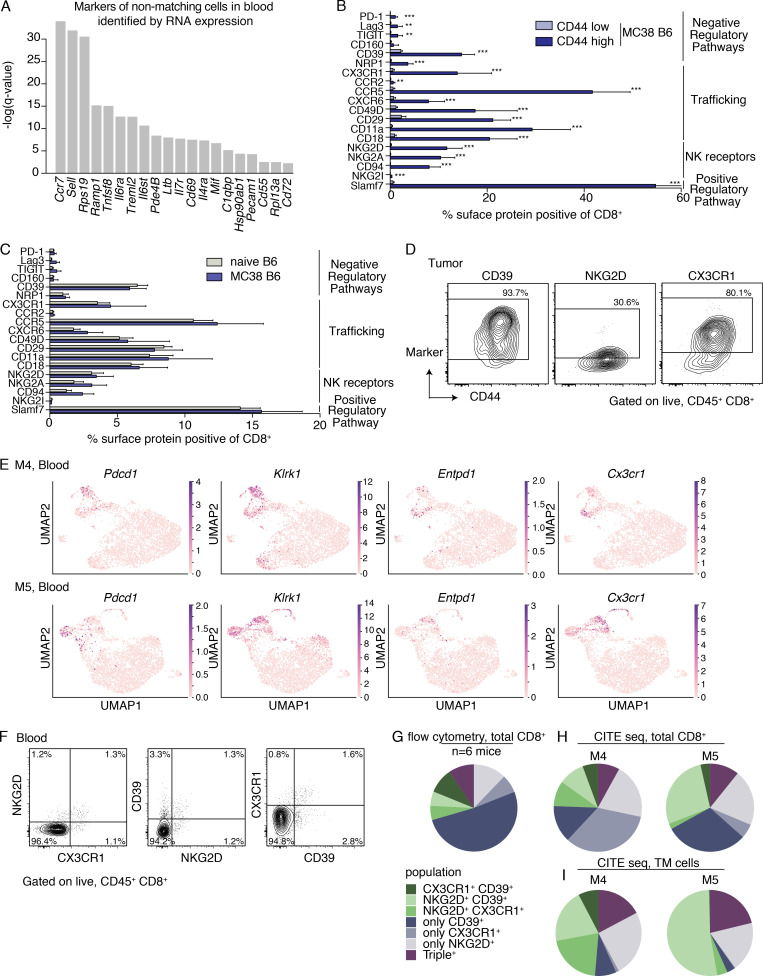
Figure S2.
Identification and validation of markers to identify TM CD8+ T cells in blood (A) Top surface markers for identifying non-TM cells from TM cells in the blood based on COMET (Delaney et al., 2019) analysis. Significance determined using an XL-minimal hypergeometric test with multiple hypothesis test corrections. scRNAseq integrated from three biological replicates (M1–3) between two independent experiments. (B) Quantification of the frequency of bulk CD8+ T cells in the peripheral blood of mice with MC38 tumors on day 21 after implantation (n = 9 mice) that express the indicated proteins using FACS. Cells are gated on singlets, live/dead−, CD45+, and CD8α+ and are further gated based on CD44 expression to compare CD44low and CD44high cells. **, P < 0.01; ***, P < 0.001. (C) Comparison of bulk CD8+ T cells (gated on singlets, live/dead−, CD45+, CD8α+) from the peripheral blood of mice with MC38 tumors on day 21 after implantation (n = 9 mice) to naive B6 mice (n = 4 mice). (B and C) Data are representative of two to four independent experiments depending on the marker, with n = 3–4 naive mice and n = 5–9 mice with MC38 tumors (days 19–22). Bars show the mean, and error bars represent SD. Significance determined using multiple t tests using the Holm-Sidak method, with α = 0.05. Each row was analyzed individually, without assuming a consistent SD. Reported are the adjusted P values considering multiple tests. Significant comparisons in B are indicated with asterisks and include PD-1, P = 2.6957 × 10⁻⁵; Lag-3, P = 0.0012; TIGIT, P = 0.0012; CD39, P = 3.7639 × 10⁻⁹; NRP1, P = 5.1172 × 10⁻⁷; CX3CR1, P = 0.0002; CCR2, P = 0.0012; CCR5, P = 6.4414 × 10⁻¹⁰; CXCR6, P = 6.1903 × 10⁻⁵; CD49, P = 0.0002; CD29, P = 1.6745 × 10⁻⁹; CD11a, P = 1.1636 × 10⁻⁷; CD18, P = 1.9906 × 10⁻⁷; NKG2D, P = 1.1863 × 10⁻⁷; NKG2A, P = 1.8567 × 10⁻⁷; CD94, P = 1.8567 × 10⁻⁷; NKG2I, P = 2.6625 × 10⁻⁶; Slamf7, P = 5.06 × 10⁻¹³. In B, CD160 expression between CD44high and CD44low was not significant. In C, there were no significant differences between naive B6 and B6 mice with MC38 tumors. (D) Representative FACS contour plots showing NKG2D, CD39, and CX3CR1 expression (y axis) as indicated above each plot and CD44 (x axis) on CD8+ T cells in the MC38 tumor of mice in Fig. 2 F. Representative of three independent experiments, each with n = 5–9 mice. (E) UMAPs showing distribution of expression of select transcripts in the blood of M4 (top) and M5 (bottom), two biological replicates from the validation cohort (one experiment). Genes include Pdcd1 (encoding PD-1), Klrk1 (encoding NKG2D), Entpd1 (encoding CD39), and Cx3cr1 (encoding CX3CR1). (F) Representative FACS contour plots showing all possible pairwise combinations of NKG2D, CD39, and CX3CR1 expression (as indicated in each plot) on CD8+ T cells in the blood of mice on day 21 after implantation of MC38 tumor cells. Plots are gated on singlets, live/dead−, CD45+, CD8α+. Numbers on plots indicate the percentage of cells within each quadrant of the total parent population. (G) Quantification of the flow cytometry plots in F showing the frequency of cells expressing one, two, or three of the indicated proteins (NKG2D, CD39, and CX3CR1) determined using Boolean gating, of the population of cells expressing at least one of the markers. Shown are the average frequencies of all possible combination gates from six mice. In G, 70.5% expressed only one of the markers but not the others, 20.1% expressed only two of the markers, and 9.4% expressed all three of the markers. Data in F and G are representative of three independent experiments with five to nine mice per experiment. (H and I) Quantification of the frequencies of cells expressing one, two, or three of the indicated proteins (NKG2D, CD39, and CX3CR1) of the population of cells expressing at least one of the markers in the blood of M4 and M5 using the CITE seq data (two biological replicates from the validation cohort; one experiment). The frequencies of all possible combination gates on the total population of cells from the CITE seq experiment (not subsetting based on TM status; H) and only the TM population (I). (H) 61.9% of cells expressed only one marker, 28.7% expressed only two markers, and 9.4% expressed all three markers (values averaged between M4 and M5). (I) 28.1% of cells expressed only one marker, 52.7% expressed only two markers, and 19.2%, expressed all three markers (values averaged between M4 and M5). The pie charts in G and H share the legend to the left of I.

