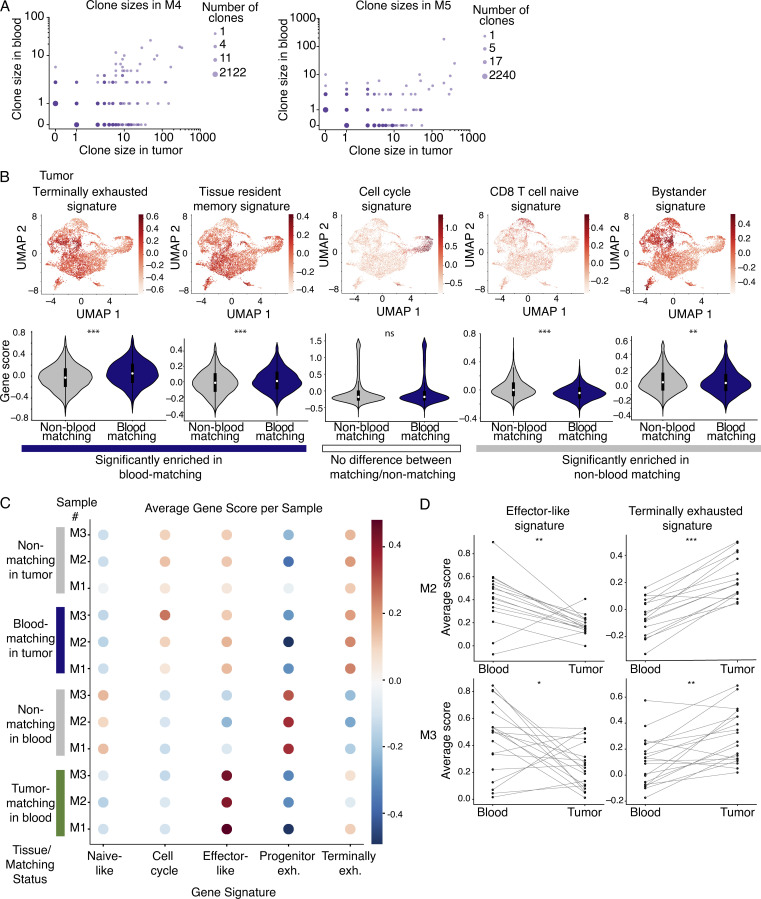
Figure S3.
TM CD8+ T cells in the blood show stronger enrichment for effector signatures and weaker enrichment for exhaustion signatures than the corresponding clones in the tumor. (A) Expansion rates of clones in blood and MC38 tumor (log scale), for M4 (left) and M5 (right). Shown are two biological replicates from the validation cohort (one experiment). Data from M1 from an independent experiment are shown in Fig. 3 D. (B) Top: UMAP visualization of signatures related to CD8+ T cell transcriptional states in the mouse integrated MC38 tumor samples. From left to right are signatures of terminal exhaustion from Miller et al. (2019); TRM cells from Beura et al. (2018); cell cycle from Kowalczyk et al. (2015); naive cells from Kaech et al. (2002); and bystander cells with TCRs that are not specific to the tumor from Mognol et al. (2017). Bottom: Violin plots quantifying the expression of each signature in blood-matching compared with non–blood matching clones. Significance determined using a Wilcoxon rank sum test. Colored bars beneath the violin plots indicate whether the mean is statistically greater in blood-matching cells (terminal exhaustion, P = 1 × 10−41; TRM P = 6.9 × 10⁻¹³), not statistically significant (cell cycle, P = 0.97), or statistically greater in non–blood-matching cells (naive, P = 2.2 × 10−65; bystander, P = 0.0016). scRNAseq integrated from three biological replicates (M1–3) between two independent experiments. (C) Shown are average gene scores per sample for mouse blood and tumor, separated by matching status. M1–3 indicate each mouse sample number (three mice between two independent experiments). For a given signature, a gene score was calculated for each cell. Shown are naive-like (Kaech et al., 2002), cell cycle (Kowalczyk et al., 2015), and the effector-like, progenitor, and terminally exhausted signatures from Miller et al. (2019). (D) Clone-by-clone analysis examining the mean expression of an effector-like gene signature or a terminal exhaustion gene signature from Miller et al. (2019). Each dot shows the average gene signature of the cells in a given clone, and lines connect the same clone between blood and tumor samples. Shown are clones detected in M2 (top) and M3 (bottom) from one experiment. Data from M1 from an independent experiment are shown in Fig. 3 E. Significance determined using a Wilcoxon signed-rank test. For M2, P = 0.0084 for the effector-like signature and P = 5.3 × 10⁻⁴ for the terminally exhausted signature. For M3, P = 0.024 for the effector-like signature, and P = 1.7 × 10⁻³ for the terminally exhausted signature. *, P< 0.05; **, P < 0.01; ***, P < 0.001; ns, not significant.

